Why Chaos? Distributed systems often assume the network is reliable, latency is zero, and resources are always available — yet these assumptions lead to outages. Chaos testing helps uncover weaknesses before they impact production.
Why Krkn? We built Krkn to be lightweight (runs outside the cluster), support both cloud and Kubernetes scenarios, perform metric checks during and after chaos, and validate resilience with post-scenario alerts. Learn more about Krkn.
Why chaos engineering matters, why we built Krkn, and how the repositories fit together.
Why Chaos?
There are a couple of false assumptions that users might have when operating and running their applications in distributed systems:
The network is reliable
There is zero latency
Bandwidth is infinite
The network is secure
Topology never changes
The network is homogeneous
Consistent resource usage with no spikes
All shared resources are available from all places
Various assumptions led to a number of outages in production environments in the past. The services suffered from poor performance or were inaccessible to the customers, leading to missing Service Level Agreement uptime promises, revenue loss, and a degradation in the perceived reliability of said services.
How can we best avoid this from happening? This is where Chaos testing can add value.
Why Krkn?
There are many chaos-related projects out there including other ones within CNCF.
We decided to create Krkn to help face some challenges we saw:
Have a lightweight application that had the ability to run outside the cluster
This gives us the ability to take down a cluster and still be able to get logs and complete our tests
Ability to have both cloud-based and Kubernetes-based scenarios
Wanted to have performance at the top of mind by completing metric checks during and after chaos
Take into account the resilience of the software by post-scenario basic alert checks
Krkn is here to solve these problems.
Repository Ecosystem
Below is a flow chart of all the Krkn-related repositories in the GitHub organization. They all build on each other, with krkn-lib being the lowest level of Kubernetes-based functions to full running scenarios, demos, and documentation.
krkn-lib — Our lowest-level repository containing all of the basic Kubernetes Python functions that make Krkn run. This also includes models of our telemetry data we output at the end of our runs and lots of functional tests. Unless you are contributing to Krkn, you won’t need to explicitly clone this repository.
Krkn — Our brain repository that takes in a YAML file of configuration and scenario files and causes chaos on a cluster. We suggest using this way of running to try out new scenarios or if you want to run a combination of scenarios in one run. A CNCF Sandbox project.
Krkn-hub — This is our containerized wrapper around Krkn that easily allows us to run with the respective environment variables without having to maintain and tweak files. This is great for CI systems. But note, with this way of running it only allows you to run one scenario at a time.
krknctl — A tool designed to run and orchestrate Krkn chaos scenarios utilizing container images from krkn-hub. Its primary objective is to streamline the usage of Krkn by providing features like scenario descriptions and detailed instructions, effectively abstracting the complexities of the container environment. This allows users to focus solely on implementing chaos engineering practices without worrying about runtime complexities. This is our recommended way of running Krkn to get started.
website — All of the above repos are documented here. If you find any issues in this documentation, please open an issue.
krkn-demos — Bash scripts and a pre-configured config file to easily see all of what Krkn is capable of, along with checks to verify it in action.
Continue reading more details about each of the repositories in the sidebar. We recommend starting with “What is Krkn?” to get details around all the features we offer before moving to Installation and the Scenarios we offer.
2 - What is Krkn?
Chaos and Resiliency Testing Tool for Kubernetes
krkn is a chaos and resiliency testing tool for Kubernetes. Krkn injects deliberate failures into Kubernetes clusters to check if it is resilient to turbulent conditions.
Use Case and Target Personas
Krkn is designed for the following user roles:
Site Reliability Engineers aiming to enhance the resilience and reliability of the Kubernetes platform and the applications it hosts. They also seek to establish a testing pipeline that ensures managed services adhere to best practices, minimizing the risk of prolonged outages.
Developers and Engineers focused on improving the performance and robustness of their application stack when operating under failure scenarios.
Kubernetes Administrators responsible for ensuring that onboarded services comply with established best practices to prevent extended downtime.
Workflow
How to Get Started
Instructions on how to setup, configure and run Krkn can be found at Installation.
You may consider utilizing the chaos recommendation tool prior to initiating the chaos runs to profile the application service(s) under test. This tool discovers a list of Krkn scenarios with a high probability of causing failures or disruptions to your application service(s). The tool can be accessed at Chaos-Recommender.
See the getting started doc on support on how to get started with your own custom scenario or editing current scenarios for your specific usage.
After installation, refer back to the below sections for supported scenarios and how to tweak the Krkn config to load them on your cluster.
Running Krkn with minimal configuration tweaks
For cases where you want to run Krkn with minimal configuration changes, refer to krkn-hub. One use case is CI integration where you do not want to carry around different configuration files for the scenarios.
Config
Instructions on how to setup the config and the options supported can be found at Config.
Krkn scenario pass/fail criteria and report
It is important to check if the targeted component recovered from the chaos injection and if the Kubernetes cluster is healthy, since failures in one component can have an adverse impact on other components. Krkn does this by:
Having built in checks for pod and node based scenarios to ensure the expected number of replicas and nodes are up. It also supports running custom scripts with the checks.
Leveraging Cerberus to monitor the cluster under test and consuming the aggregated go/no-go signal to determine pass/fail post chaos.
It is highly recommended to turn on the Cerberus health check feature available in Krkn. Instructions on installing and setting up Cerberus can be found here or can be installed from Krkn using the instructions.
Once Cerberus is up and running, set cerberus_enabled to True and cerberus_url to the url where Cerberus publishes go/no-go signal in the Krkn config file.
Cerberus can monitor application routes during the chaos and fails the run if it encounters downtime as it is a potential downtime in a customers or users environment.
It is especially important during the control plane chaos scenarios including the API server, Etcd, Ingress, etc.
It can be enabled by setting check_application_routes: True in the Krkn config provided application routes are being monitored in the cerberus config.
Leveraging built-in alert collection feature to fail the runs in case of critical alerts.
See also: SLOs validation for more details on metrics and alerts
Fail test if certain metrics aren’t met at the end of the run
Krkn Features
Signaling
In CI runs or any external job it is useful to stop Krkn once a certain test or state gets reached. We created a way to signal to Krkn to pause the chaos or stop it completely using a signal posted to a port of your choice.
For example, if we have a test run loading the cluster running and Krkn separately running, we want to be able to know when to start/stop the Krkn run based on when the test run completes or when it gets to a certain loaded state
More detailed information on enabling and leveraging this feature can be found here.
Performance monitoring
Monitoring the Kubernetes/OpenShift cluster to observe the impact of Krkn chaos scenarios on various components is key to find out the bottlenecks. It is important to make sure the cluster is healthy in terms of both recovery and performance during and after the failure has been injected. Instructions on enabling it within the config can be found here.
SLOs validation during and post chaos
In addition to checking the recovery and health of the cluster and components under test, Krkn takes in a profile with the Prometheus expressions to validate and alerts, exits with a non-zero return code depending on the severity set. This feature can be used to determine pass/fail or alert on abnormalities observed in the cluster based on the metrics.
Krkn also provides ability to check if any critical alerts are firing in the cluster post chaos and pass/fail’s.
Information on enabling and leveraging this feature can be found here
Health Checks
Health checks provide real-time visibility into the impact of chaos scenarios on application availability and performance. The system periodically checks the provided URLs based on the defined interval and records the results in Telemetry. To read more about how to properly configure health checks in your krkn run and sample output see health checks document.
Telemetry
We gather some basic details of the cluster configuration and scenarios ran as part of a telemetry set of data that is printed off at the end of each krkn run. You can also opt in to the telemetry being stored in AWS S3 bucket or elasticsearch for long term storage. Find more details and configuration specifics here
Resiliency Scoring
We have a powerful feature to quantify your system’s stability during chaos experiments. The Resiliency Score is a percentage (0-100%) calculated from a weighted evaluation of SLOs firing in Prometheus. This moves beyond a simple pass/fail, giving you a clear, data-driven metric to track your resilience over time. Find a detailed explanation of the scoring algorithm and configuration options here.
This section defines scenarios and specific data to the chaos run
Distribution
The distribution is now automatically set based on some verification points. Depending on which distribution, either openshift or kubernetes other parameters will be automatically set.
The prometheus url/route and bearer token are automatically obtained in case of OpenShift, please be sure to set it when the distribution is Kubernetes.
Exit on failure
exit_on_failure: Exit when a post action check or cerberus run fails
publish_kraken_status: Can be accessed at http://0.0.0.0:8081 (or what signal_address and port you set in signal address section)
signal_state: State you want krkn to start at; will wait for the RUN signal to start running a chaos iteration. When set to PAUSE before running the scenarios
signal_address: Address to listen/post the signal state to
port: port to listen/post the signal state to
Chaos Scenarios
chaos_scenarios: List of different types of chaos scenarios you want to run with paths to their specific yaml file configurations.
Currently the scenarios are run one after another (in sequence) and will exit if one of the scenarios fail, without moving onto the next one. You can find more details on each scenario under the Scenario folder.
Chaos scenario types:
pod_disruption_scenarios
container_scenarios
hog_scenarios
node_scenarios
time_scenarios
cluster_shut_down_scenarios
namespace_scenarios
zone_outages
application_outages
pvc_scenarios
network_chaos
pod_network_scenarios
service_disruption_scenarios
service_hijacking_scenarios
syn_flood_scenarios
Cerberus
Parameters to set for enabling of cerberus checks at the end of each executed scenario. The given url will pinged after the scenario and post action check have been completed for each scenario and iteration. Read more about what cerberus is here
cerberus_enabled: Enable it when cerberus is previously installed
cerberus_url: When cerberus_enabled is set to True, provide the url where cerberus publishes go/no-go signal
check_applicaton_routes: When enabled will look for application unavailability using the routes specified in the cerberus config and fails the run
Performance Monitoring
prometheus_url: The prometheus url/route is automatically obtained in case of OpenShift, please set it when the distribution is Kubernetes.
prometheus_bearer_token: The bearer token is automatically obtained in case of OpenShift, please set it when the distribution is Kubernetes. This is needed to authenticate with prometheus.
uuid: Uuid for the run, a new random one is generated by default if not set. Each chaos run should have its own unique UUID
enable_alerts: True or False; Runs the queries specified in the alert profile and displays the info or exits 1 when severity=error
enable_metrics: True or False, capture metrics defined by the metrics profile
alert_profile: Path or URL to alert profile with the prometheus queries, see a sample of an alerts file of some preconfigured alerts we have set up and more documentation around it here
metrics_profile: Path or URL to metrics profile with the prometheus queries to capture certain metrics on, see more details around metrics on its documentation page
check_critical_alerts: True or False; When enabled will check prometheus for critical alerts firing post chaos. Read more about this functionality in SLOs validation
Resiliency
The resiliency scoring system evaluates your cluster’s health during chaos scenarios by checking Service Level Objectives (SLOs) against Prometheus metrics. See Resiliency Scoring for detailed information about the scoring algorithm and SLO configuration.
resiliency_run_mode: Determines how resiliency scoring operates. Options are:
standalone (default): Calculates the resiliency score and embeds it in the telemetry output
controller: Prints the resiliency report to stdout for krknctl integration (used when running under krknctl)
disabled: Completely disables resiliency scoring
resiliency_file: Path to the YAML file containing SLO definitions. If not specified, defaults to the alert_profile setting from performance_monitoring, or config/alerts.yaml if neither is set. The file should contain a list of SLO definitions with Prometheus expressions. See Resiliency Scoring for examples of SLO definitions and custom weight configuration.
Custom weights for individual SLOs to emphasize business-critical services
Per-scenario scoring with weighted aggregation for multi-scenario runs
Detailed breakdown reports showing which SLOs passed/failed
Elastic
We have enabled the ability to store telemetry, metrics and alerts into ElasticSearch based on the below keys and values.
enable_elastic: True or False; If true, the telemetry data will be stored in the telemetry_index defined below. Based on if value of performance_monitoring.enable_alerts and performance_monitoring.enable_metrics are true or false, alerts and metrics will be saved in addition to each of the indexes
verify_certs: True or False
elastic_url: The url of the ElasticeSearch where you want to store data
username: ElasticSearch username
password: ElasticSearch password
metrics_index: ElasticSearch index where you want to store the metrics details, the alerts captured are defined from the performance_monitoring.metrics_profile variable and can be captured based on value of performance_monitoring.enable_alenable_metricserts
alerts_index: ElasticSearch index where you want to store the alert details, the alerts captured are defined from the performance_monitoring.alert_profile variable and can be captured based on value of performance_monitoring.enable_alerts
telemetry_index: ElasticSearch index where you want to store the telemetry details
Tunings
wait_duration: Duration to wait between each chaos scenario
iterations: Number of times to execute the scenarios
daemon_mode: True or False; If true, iterations are set to infinity which means that the krkn will cause chaos forever and number of iterations is ignored
Telemetry
More details on the data captured in the telmetry and how to set up your own telemetry data storage can be found here
enabled: True or False, enable/disables the telemetry collection feature
prometheus_backup: True or False, enables/disables prometheus data collection
prometheus_namespace: Namespace where prometheus is deployed, only needed if distribution is kubernetes
prometheus_container_name: Name of the prometheus container name, only needed if distribution is kubernetes
prometheus_pod_name: Name of the prometheus pod, only needed if distribution is kubernetes
full_prometheus_backup: True or False, if is set to False only the /prometheus/wal folder will be downloaded.
backup_threads: Number of telemetry download/upload threads, default is 5
archive_path: Local path where the archive files will be temporarly stored, default is /tmp
max_retries: Maximum number of upload retries (if 0 will retry forever), defaulted to 0
run_tag: If set, this will be appended to the run folder in the bucket (useful to group the runs)
archive_size: The size of the prometheus data archive size in KB. The lower the size of archive is the higher the number of archive files will be produced and uploaded (and processed by backup_threads simultaneously). For unstable/slow connection is better to keep this value low increasing the number of backup_threads, in this way, on upload failure, the retry will happen only on the failed chunk without affecting the whole upload.
telemetry_group: If set will archive the telemetry in the S3 bucket on a folder named after the value, otherwise will use “default”
logs_backup: True
logs_filter_patterns: Way to filter out certain times from the logs
oc_cli_path: Optional, if not specified will be search in $PATH, default is /usr/bin/oc
events_backup: True or False, this will capture events that occurred during the chaos run. Will be saved to {archive_path}/events.json
Health Checks
Utilizing health check endpoints to observe application behavior during chaos injection, see more details about how this works and different ways to configure here
interval: Interval in seconds to perform health checks, default value is 2 seconds
config: Provide list of health check configurations for applications
url: Provide application endpoint
bearer_token: Bearer token for authentication if any
auth: Provide authentication credentials (username , password) in tuple format if any, ex:(“admin”,“secretpassword”)
exit_on_failure: If value is True exits when health check failed for application, values can be True/False
Virt Checks
Utilizing kube virt checks observe VMI’s ssh connection behavior during chaos injection, see more details about how this works and different ways to configure here
interval: Interval in seconds to perform virt checks, default value is 2 seconds
namespace: VMI Namespace, needs to be set or checks won’t be run
name: Provided VMI regex name to match on; optional, if left blank will find all names in namespace
only_failures: Boolean of whether to show all VMI’s failures and successful ssh connection (False), or only failure status’ (True)
disconnected: Boolean of how to try to connect to the VMIs; if True will use the ip_address to try ssh from within a node, if false will use the name and uses virtctl to try to connect; Default is False
ssh_node: If set, will be a backup way to ssh to a node. Will want to set to a node that isn’t targeted in chaos
node_names: List of node names to further filter down the VM’s, will only watch VMs with matching name in the given namespace that are running on node. Can put multiple by separating by a comma
Sample Config file
kraken:kubeconfig_path:~/.kube/config # Path to kubeconfigexit_on_failure:False# Exit when a post action scenario failspublish_kraken_status:True# Can be accessed at http://0.0.0.0:8081signal_state:RUN # Will wait for the RUN signal when set to PAUSE before running the scenarios, refer docs/signal.md for more detailssignal_address:0.0.0.0# Signal listening addressport:8081# Signal portchaos_scenarios:# List of policies/chaos scenarios to load- hog_scenarios:- scenarios/kube/cpu-hog.yml- scenarios/kube/memory-hog.yml- scenarios/kube/io-hog.yml- application_outages_scenarios:- scenarios/openshift/app_outage.yaml- container_scenarios:# List of chaos pod scenarios to load- scenarios/openshift/container_etcd.yml- pod_network_scenarios:- scenarios/openshift/network_chaos_ingress.yml- scenarios/openshift/pod_network_outage.yml- pod_disruption_scenarios:- scenarios/openshift/etcd.yml- scenarios/openshift/regex_openshift_pod_kill.yml- scenarios/openshift/prom_kill.yml- scenarios/openshift/openshift-apiserver.yml- scenarios/openshift/openshift-kube-apiserver.yml- node_scenarios:# List of chaos node scenarios to load- scenarios/openshift/aws_node_scenarios.yml- scenarios/openshift/vmware_node_scenarios.yml- scenarios/openshift/ibmcloud_node_scenarios.yml- time_scenarios:# List of chaos time scenarios to load- scenarios/openshift/time_scenarios_example.yml- cluster_shut_down_scenarios:- scenarios/openshift/cluster_shut_down_scenario.yml- service_disruption_scenarios:- scenarios/openshift/regex_namespace.yaml- scenarios/openshift/ingress_namespace.yaml- zone_outages_scenarios:- scenarios/openshift/zone_outage.yaml- pvc_scenarios:- scenarios/openshift/pvc_scenario.yaml- network_chaos_scenarios:- scenarios/openshift/network_chaos.yaml- service_hijacking_scenarios:- scenarios/kube/service_hijacking.yaml- syn_flood_scenarios:- scenarios/kube/syn_flood.yamlcerberus:cerberus_enabled:False# Enable it when cerberus is previously installedcerberus_url:# When cerberus_enabled is set to True, provide the url where cerberus publishes go/no-go signalcheck_applicaton_routes:False# When enabled will look for application unavailability using the routes specified in the cerberus config and fails the runperformance_monitoring:deploy_dashboards:False# Install a mutable grafana and load the performance dashboards. Enable this only when running on OpenShiftrepo:"https://github.com/cloud-bulldozer/performance-dashboards.git"prometheus_url:''# The prometheus url/route is automatically obtained in case of OpenShift, please set it when the distribution is Kubernetes.prometheus_bearer_token:# The bearer token is automatically obtained in case of OpenShift, please set it when the distribution is Kubernetes. This is needed to authenticate with prometheus.uuid:# uuid for the run is generated by default if not setenable_alerts:False# Runs the queries specified in the alert profile and displays the info or exits 1 when severity=errorenable_metrics:Falsealert_profile:config/alerts.yaml # Path or URL to alert profile with the prometheus queriesmetrics_profile:config/metrics-report.yamlcheck_critical_alerts:False# When enabled will check prometheus for critical alerts firing post chaoselastic:enable_elastic:Falseverify_certs:Falseelastic_url:""# To track results in elasticsearch, give url to server here; will post telemetry details when url and index not blankelastic_port:32766username:"elastic"password:"test"metrics_index:"krkn-metrics"alerts_index:"krkn-alerts"telemetry_index:"krkn-telemetry"tunings:wait_duration:60# Duration to wait between each chaos scenarioiterations:1# Number of times to execute the scenariosdaemon_mode:False# Iterations are set to infinity which means that the kraken will cause chaos forevertelemetry:enabled:False# enable/disables the telemetry collection featureapi_url:https://ulnmf9xv7j.execute-api.us-west-2.amazonaws.com/production#telemetry service endpointusername:username # telemetry service usernamepassword:password # telemetry service passwordprometheus_backup:True# enables/disables prometheus data collectionprometheus_namespace:""# namespace where prometheus is deployed (if distribution is kubernetes)prometheus_container_name:""# name of the prometheus container name (if distribution is kubernetes)prometheus_pod_name:""# name of the prometheus pod (if distribution is kubernetes)full_prometheus_backup:False# if is set to False only the /prometheus/wal folder will be downloaded.backup_threads:5# number of telemetry download/upload threadsarchive_path:/tmp # local path where the archive files will be temporarly storedmax_retries:0# maximum number of upload retries (if 0 will retry forever)run_tag:''# if set, this will be appended to the run folder in the bucket (useful to group the runs)archive_size:500000telemetry_group:''# if set will archive the telemetry in the S3 bucket on a folder named after the value, otherwise will use "default"# the size of the prometheus data archive size in KB. The lower the size of archive is# the higher the number of archive files will be produced and uploaded (and processed by backup_threads# simultaneously).# For unstable/slow connection is better to keep this value low# increasing the number of backup_threads, in this way, on upload failure, the retry will happen only on the# failed chunk without affecting the whole upload.logs_backup:Truelogs_filter_patterns:- "(\\w{3}\\s\\d{1,2}\\s\\d{2}:\\d{2}:\\d{2}\\.\\d+).+"# Sep 9 11:20:36.123425532- "kinit (\\d+/\\d+/\\d+\\s\\d{2}:\\d{2}:\\d{2})\\s+"# kinit 2023/09/15 11:20:36 log- "(\\d{4}-\\d{2}-\\d{2}T\\d{2}:\\d{2}:\\d{2}\\.\\d+Z).+"# 2023-09-15T11:20:36.123425532Z logoc_cli_path:/usr/bin/oc # optional, if not specified will be search in $PATHevents_backup:True# enables/disables cluster events collectionhealth_checks:# Utilizing health check endpoints to observe application behavior during chaos injection.interval:# Interval in seconds to perform health checks, default value is 2 secondsconfig:# Provide list of health check configurations for applications- url:# Provide application endpointbearer_token:# Bearer token for authentication if anyauth:# Provide authentication credentials (username , password) in tuple format if any, ex:("admin","secretpassword")exit_on_failure:# If value is True exits when health check failed for application, values can be True/Falsekubevirt_checks:# Utilizing virt check endpoints to observe ssh ability to VMI's during chaos injection.interval:2# Interval in seconds to perform virt checks, default value is 2 secondsnamespace:# Namespace where to find VMI'sname:# Regex Name style of VMI's to watch; optional, if left blank will find all names in namespaceonly_failures:False# Boolean of whether to show all VMI's failures and successful ssh connection (False), or only failure status' (True) ssh_node:""# If set, will be a backup way to ssh to a node. Will want to set to a node that isn't targeted in chaosnode_names:""# List of node names to further filter down the VM's, will only watch VMs with matching name in the given namespace that are running on node. Can put multiple by separating by a comma
2.2 - Health Checks
Health Checks to analyze down times of applications
Health Checks
Health checks provide real-time visibility into the impact of chaos scenarios on application availability and performance. Health check configuration supports application endpoints accessible via http / https along with authentication mechanism such as bearer token and authentication credentials.
Health checks are configured in the config.yaml
The system periodically checks the provided URLs based on the defined interval and records the results in Telemetry. The telemetry data includes:
Success response 200 when the application is running normally.
Failure response other than 200 if the application experiences downtime or errors.
This helps users quickly identify application health issues and take necessary actions.
Sample health check config
health_checks:interval:<time_in_seconds> # Defines the frequency of health checks, default value is 2 secondsconfig:# List of application endpoints to check- url:"https://example.com/health"bearer_token:"hfjauljl..."# Bearer token for authentication if anyauth:exit_on_failure:True# If value is True exits when health check failed for application, values can be True/Falseverify_url:True# SSL Verification of URL, default to true- url:"https://another-service.com/status"bearer_token:auth:("admin","secretpassword") # Provide authentication credentials (username , password) in tuple format if any, ex:("admin","secretpassword")exit_on_failure:Falseverify_url:False- url:http://general-service.combearer_token:auth:exit_on_failure:verify_url:False
RBAC Authorization rules required to run Krkn scenarios.
RBAC Configurations
Krkn supports two types of RBAC configurations:
Ns-Privileged RBAC: Provides namespace-scoped permissions for scenarios that only require access to resources within a specific namespace.
Privileged RBAC: Provides cluster-wide permissions for scenarios that require access to cluster-level resources like nodes.
INFO
The examples below use placeholders such as target-namespace and krkn-namespace which should be replaced with your actual namespaces. The service account name krkn-sa is also a placeholder that you can customize.
RBAC YAML Files
Ns-Privileged Role
The ns-privileged role provides permissions limited to namespace-scoped resources:
Continue to improve Chaos Testing Guide in terms of adding best practices, test environment recommendations and scenarios to make sure the OpenShift platform, as well the applications running on top it, are resilient and performant under chaotic conditions.
Virt checks provide real-time visibility into the impact of chaos scenarios on VMI ssh connectivity and performance.
Virt checks are configured in the config.yamlhere
The system periodically checks the VMI’s in the provided namespace based on the defined interval and records the results in Telemetry. The checks will run continuously from the very beginning of krkn until all scenarios are done and wait durations are complete. The telemetry data includes:
Success status True when the VMI is up and running and can form an ssh connection
Failure response False if the VMI experiences downtime or errors.
The VMI Name
The VMI Namespace
The VMI Ip Address and a New IP Address if the VMI is deleted
The time of the start and end of the specific status
The duration the VMI had the specific status
The node the VMI is running on
This helps users quickly identify VMI issues and take necessary actions.
Additional Installation of VirtCtl (If running using Krkn)
It is required to have virtctl or an ssh connection via a bastion host to be able to run this option. We don’t recommend using the krew installation type.
This is only required if you are running locally with python Krkn version, the virtctl command will be automatically installed in the krkn-hub and krknctl images
kubevirt_checks:# Utilizing virt check endpoints to observe ssh ability to VMI's during chaos injection.interval:2# Interval in seconds to perform virt checks, default value is 2 seconds, requirednamespace:runner # Regex Namespace where to find VMI's, required for checks to be enabledname:"^windows-vm-.$"# Regex Name style of VMI's to watch, optional, if left blank will find all names in namespaceonly_failures:False# Boolean of whether to show all VMI's failures and successful ssh connection (False), or only failure status' (True) disconnected:False# Boolean of how to try to connect to the VMIs; if True will use the ip_address to try ssh from within a node, if false will use the name and uses virtctl to try to connect ssh_node:""# If set, will be a backup way to ssh to a node. Will want to set to a node that isn't targeted in chaosnode_names:""# List of node names to further filter down the VM's, will only watch VMs with matching name in the given namespace that are running on node. Can put multiple by separating by a commaexit_on_failure:# If value is True and VMI's are failing post chaos returns failure, values can be True/False
Disconnected Environment
The disconnected variable set in the config bypasses the kube-apiserver and SSH’s directly to the worker nodes to test SSH connection to the VM’s IP address.
When using disconnected: true, you must configure SSH authentication to the worker nodes. This requires passing your SSH private key to the container.
Configuration:
disconnected:True# Boolean of how to try to connect to the VMIs; if True will use the ip_address to try ssh from within a node, if false will use the name and uses virtctl to try to connect
SSH Key Setup for krkn-hub or krknctl:
You need to mount your SSH private and/or public key into the container to enable SSH connection to the worker nodes. Pass the id_rsa variable with the path to your SSH keys:
# Example with krknctlkrknctl run --config config.yaml -e id_rsa=/path/to/your/id_rsa
# Example with krkn-hubpodman run --name=<container_name> --net=host \
-v /path/to/your/id_rsa:/home/krkn/.ssh/id_rsa:Z \.# do not change path on right of colon -v /path/to/your/id_rsa.pub:/home/krkn/.ssh/id_rsa.pub:Z \.# do not change path on right of colon -v /path/to/config.yaml:/root/kraken/config/config.yaml:Z \
-d quay.io/krkn-chaos/krkn-hub:<scenario_type>
Note: Ensure your SSH key has appropriate permissions (chmod 644 id_rsa) and matches the key authorized on your worker nodes.
Post Virt Checks
After all scenarios have finished executing, krkn will perform a final check on the VMs matching the specified namespace and name. It will attempt to reach each VM and provide a list of any that are still unreachable at the end of the run. The list can be seen in the telemetry details at the end of the run.
Sample virt check telemetry
Notice here that the vm with name windows-vm-1 had a false status (not able to form an ssh connection), for the first 37 seconds (the first item in the list). And at the end of the run the vm was able to for the ssh connection and reports true status for 41 seconds. While the vm with name windows-vm-0 has a true status the whole length of the chaos run (~88 seconds).
Resiliency Scoring Calculation Algorithm and Configuration
WARNING
Beta Feature: Resiliency Scoring is currently in Beta. The API, configuration format, and scoring behavior may change in future releases.
If you encounter any issues or unexpected behavior, please open a bug report at github.com/krkn-chaos/krkn/issues. Include your configuration, krkn version, and any relevant logs or output.
Introduction
What is the Resiliency Score?
The Resiliency Score is a percentage (0-100%) that represents the health and stability of your Kubernetes cluster during a chaos scenario. It is calculated by evaluating a set of Service Level Objectives (SLOs) against live Prometheus data.
Why use it?
A simple pass or fail doesn’t tell the whole story. A score of 95% indicates a robust system with minor degradation, while a score of 60% reveals significant issues that need investigation, even if the chaos scenario technically “passed”. This allows you to track resilience improvements over time and make data-driven decisions.
How does it work?
After a chaos scenario completes, Krkn evaluates a list of pre-defined SLOs (which are Prometheus alert expressions) over the chaos time window. It counts how many SLOs passed and failed, applies a weighted scoring model, and embeds a detailed report in the final telemetry output.
The Scoring Algorithm
The final score is calculated using a weighted pass/fail model. By default, weights are based on SLO severity, but you can also assign custom weights to individual SLOs for more granular control.
SLO Severity and Default Weights
Each SLO is assigned a severity of either warning or critical:
Warning: Represents performance degradation or minor issues. Worth 1 point by default.
Critical: Represents significant service impairment or outages. Worth 3 points by default.
Custom Weights
In addition to severity-based weighting, you can assign a custom weight to any individual SLO. This allows you to fine-tune the scoring model based on your specific requirements. When a custom weight is specified, it overrides the default severity-based weight for that SLO.
Use cases for custom weights:
Emphasize business-critical SLOs beyond standard severity levels
De-emphasize less important warnings
Create custom scoring profiles for different environments or use cases
Formula
The score is calculated as a percentage of the total possible points achieved.
Chaos Outcome: The SLO with weight 10 failed, and 1 critical SLO failed.
Points Lost:10 + 3 = 13.
Final Score:((23 - 13) / 23) * 100 = 43.5%.
Defining SLOs with Custom Weights
SLOs are defined in the alerts YAML file (typically config/alerts.yaml). The format supports both the traditional severity-only format and an extended format with custom weights.
Traditional Format (Severity Only)
- expr:avg_over_time(histogram_quantile(0.99, rate(etcd_disk_wal_fsync_duration_seconds_bucket[2m]))[10m:]) > 0.01description:10minutes avg. 99th etcd fsync latency higher than 10msseverity:warning- expr:etcd_server_has_leader{job=~".*etcd.*"} == 0description:etcd cluster has no leaderseverity:critical
In this format, the weight is automatically determined by severity: critical = 3 points, warning = 1 point.
Extended Format (With Custom Weight)
- expr:avg_over_time(histogram_quantile(0.99, rate(etcd_disk_wal_fsync_duration_seconds_bucket[2m]))[10m:]) > 0.01description:10minutes avg. 99th etcd fsync latency higher than 10msseverity:warningweight:5- expr:etcd_server_has_leader{job=~".*etcd.*"} == 0description:etcd cluster has no leaderseverity:criticalweight:10
In this format, you specify an explicit weight value that overrides the default severity-based weight. The severity field is still required for classification purposes.
Mixed Format Example
You can mix both formats in the same file:
# Business-critical SLO with custom high weight- expr:up{job="payment-service"} == 0description:Payment service is downseverity:criticalweight:15# Standard critical SLO (uses default weight of 3)- expr:etcd_server_has_leader{job=~".*etcd.*"} == 0description:etcd cluster has no leaderseverity:critical# Low-priority warning with reduced weight- expr:node_filesystem_free_bytes{mountpoint="/"} / node_filesystem_size_bytes < 0.1description:Root filesystem less than 10% freeseverity:warningweight:0.5# Standard warning (uses default weight of 1)- expr:rate(http_requests_total{code="500"}[5m]) > 0.01description:High rate of 500 errorsseverity:warning
Configuration
The resiliency scoring system can be configured in your Krkn configuration file (config/config.yaml). If no resiliency section is specified, Krkn will automatically run in standalone mode and use the alerts file defined under performance_monitoring: - alert_profile: <alerts.yaml>.
resiliency_run_mode: Determines how resiliency scoring operates
standalone (default): Calculates score and embeds in telemetry output
controller: Prints resiliency report to stdout for krknctl integration
disabled: Disables resiliency scoring
resiliency_file: Path to the YAML file containing SLO definitions. If not specified, defaults to the alert_profile setting from performance_monitoring, or config/alerts.yaml if neither is set.
Execution Modes
Krkn supports three execution modes:
Mode 1: Standalone (Default)
Uses config/alerts.yaml or the file specified in configuration.
Runs the chaos scenario.
Loads SLO definitions from the alerts file.
Evaluates each SLO against Prometheus over the chaos time window.
Calculates the score and writes an overview into kraken.report and the full report in resiliency-report.json.
For multi-scenario runs with per-scenario weighting and parallel execution, use krknctl.
Architecture and Implementation
A single Resiliency class in krkn/resiliency/resiliency.py manages the entire lifecycle:
Initialization
Loads SLO definitions from the alerts YAML file
Parses both traditional (severity-only) and extended (with custom weights) formats
Detects the execution mode from configuration
Evaluation
Iterates through each SLO and executes its Prometheus expr query over the chaos time window
Uses the evaluate_slos() function from krkn/prometheus/collector.py
Result Mapping
A non-empty query result marks the SLO as failed
An empty result marks it as passed
SLOs that return no data from Prometheus are excluded from scoring
Scoring
For each SLO, determines the weight: uses custom weight if specified, otherwise uses severity-based weight (critical = 3, warning = 1)
Calculates total points and points lost
Derives the percentage score using the formula above
Reporting
Standalone mode: Embeds the report into telemetry and writes to kraken.report
Controller mode: Serializes the report to JSON and prints with the KRKN_RESILIENCY_REPORT_JSON: prefix for krknctl consumption
Scenario-based Resiliency Scoring
For multi-scenario chaos runs, Krkn supports per-scenario resiliency scoring with weighted aggregation:
Each scenario gets its own resiliency score calculated over its specific time window
Each scenario can have a weight assigned (default: 1.0)
The final resiliency score is a weighted average of all scenario scores
Weighted Average Formula:
Final Score = Σ(scenario_score × scenario_weight) / Σ(scenario_weight)
This allows you to prioritize certain scenarios over others when calculating the overall resiliency score for a chaos run.
Best Practices
Start with Severity-based Weights: Use the default severity-based weights (critical=3, warning=1) as a baseline.
Apply Custom Weights Strategically: Only use custom weights for SLOs that truly warrant special attention:
Business-critical services that require higher weight than standard critical SLOs
Low-impact warnings that should have minimal effect on the score
Document Your Weighting Decisions: Add comments in your alerts.yaml to explain why specific custom weights were chosen.
Test Your Scoring Profile: Run chaos scenarios and review the resulting scores to ensure your weighting model reflects your actual priorities.
Version Control Your Alerts: Keep your alerts.yaml in version control and track changes to your SLO definitions and weights over time.
Use Consistent Weight Scales: If using custom weights, maintain a consistent scale (e.g., 1-20) to make weights comparable across SLOs.
Example: Complete Alerts Profile with Custom Weights
# Business-critical: Payment processing must stay available- expr:up{job="payment-api"} == 0description:Payment API is completely downseverity:criticalweight:20# Business-critical: Core authentication service- expr:up{job="auth-service"} == 0description:Authentication service is downseverity:criticalweight:15# Standard critical: etcd cluster health (uses default weight of 3)- expr:etcd_server_has_leader{job=~".*etcd.*"} == 0description:etcd cluster has no leaderseverity:critical# High-priority warning: API latency- expr:histogram_quantile(0.99, sum(rate(http_request_duration_seconds_bucket[5m])) by (le)) > 1description:99th percentile API latency exceeds 1sseverity:warningweight:5# Standard warning: Disk space (uses default weight of 1)- expr:node_filesystem_avail_bytes{mountpoint="/"} / node_filesystem_size_bytes < 0.2description:Root filesystem less than 20% freeseverity:warning# Low-priority informational warning- expr:rate(http_requests_total{code=~"4.."}[5m]) > 10description:High rate of client errorsseverity:warningweight:0.5
In this example:
Payment API downtime has the highest weight (20 points)
Auth service downtime is also critical but slightly less weighted (15 points)
Standard etcd health uses the default critical weight (3 points)
API latency warnings are more important than standard warnings (5 points vs 1 point)
Client error warnings have reduced impact (0.5 points)
This creates a scoring model that heavily emphasizes business-critical services while still accounting for platform stability and performance issues.
2.7 - Signaling to Krkn
Signal to stop/start/pause krkn
This functionality allows a user to be able to pause or stop the Krkn run at any time no matter the number of iterations or daemon_mode set in the config.
If publish_kraken_status is set to True in the config, Krkn will start up a connection to a url at a certain port to decide if it should continue running.
By default, it will get posted to http://0.0.0.0:8081/
An example use case for this feature would be coordinating Krkn runs based on the status of the service installation or load on the cluster.
States
There are 3 states in the Krkn status:
PAUSE: When the Krkn signal is ‘PAUSE’, this will pause the Krkn test and wait for the wait_duration until the signal returns to RUN.
STOP: When the Krkn signal is ‘STOP’, end the Krkn run and print out report.
RUN: When the Krkn signal is ‘RUN’, continue Krkn run based on iterations.
Configuration
In the config you need to set these parameters to tell Krkn which port to post the Krkn run status to.
As well if you want to publish and stop running based on the Krkn status or not.
The signal is set to RUN by default, meaning it will continue to run the scenarios. It can set to PAUSE for Krkn to act as listener and wait until set to RUN before injecting chaos.
    port: 8081
    publish_kraken_status: True
    signal_state: RUN
Setting Signal
You can reset the Krkn status during Krkn execution with a set_stop_signal.py script with the following contents:
Make sure to set the correct port number in your set_stop_signal script.
Url Examples
To stop run:
curl -X POST http:/0.0.0.0:8081/STOP
To pause run:
curl -X POST http:/0.0.0.0:8081/PAUSE
To start running again:
curl -X POST http:/0.0.0.0:8081/RUN
2.8 - SLO Validation
Validation points in krkn
SLOs validation
Krkn has a few different options that give a Pass/fail based on metrics captured from the cluster is important in addition to checking the health status and recovery. Krkn supports:
Checking for critical alerts post chaos
If enabled, the check runs at the end of each scenario ( post chaos ) and Krkn exits in case critical alerts are firing to allow user to debug. You can enable it in the config:
performance_monitoring:check_critical_alerts:False# When enabled will check prometheus for critical alerts firing post chaos
Validation and alerting based on the queries defined by the user during chaos
Takes PromQL queries as input and modifies the return code of the run to determine pass/fail. It’s especially useful in case of automated runs in CI where user won’t be able to monitor the system. This feature can be enabled in the config by setting the following:
performance_monitoring:prometheus_url:# The prometheus url/route is automatically obtained in case of OpenShift, please set it when the distribution is Kubernetes.prometheus_bearer_token:# The bearer token is automatically obtained in case of OpenShift, please set it when the distribution is Kubernetes. This is needed to authenticate with prometheus.enable_alerts:True# Runs the queries specified in the alert profile and displays the info or exits 1 when severity=error.alert_profile:config/alerts.yaml # Path to alert profile with the prometheus queries.
Alert profile
A couple of alert profilesalerts are shipped by default and can be tweaked to add more queries to alert on. User can provide a URL or path to the file in the config. The following are a few alerts examples:
- expr:avg_over_time(histogram_quantile(0.99, rate(etcd_disk_wal_fsync_duration_seconds_bucket[2m]))[5m:]) > 0.01description:5minutes avg. etcd fsync latency on {{$labels.pod}} higher than 10ms {{$value}}severity:error- expr:avg_over_time(histogram_quantile(0.99, rate(etcd_network_peer_round_trip_time_seconds_bucket[5m]))[5m:]) > 0.1description:5minutes avg. etcd network peer round trip on {{$labels.pod}} higher than 100ms {{$value}}severity:info- expr:increase(etcd_server_leader_changes_seen_total[2m]) > 0description:etcd leader changes observedseverity:critical
Krkn supports setting the severity for the alerts with each one having different effects:
info:Prints an info message with the alarm description to stdout. By default all expressions have this severity.warning:Prints a warning message with the alarm description to stdout.error:Prints a error message with the alarm description to stdout and sets Krkn rc = 1critical:Prints a fatal message with the alarm description to stdout and exits execution inmediatly with rc != 0
Metrics Profile
A couple of metric profiles, metrics.yaml, and metrics-aggregated.yaml are shipped by default and can be tweaked to add more metrics to capture during the run. The following are the API server metrics for example:
metrics:# API server- query:histogram_quantile(0.99, sum(rate(apiserver_request_duration_seconds_bucket{apiserver="kube-apiserver", verb!~"WATCH", subresource!="log"}[2m])) by (verb,resource,subresource,instance,le)) > 0metricName:API99thLatency- query:sum(irate(apiserver_request_total{apiserver="kube-apiserver",verb!="WATCH",subresource!="log"}[2m])) by (verb,instance,resource,code) > 0metricName:APIRequestRate- query:sum(apiserver_current_inflight_requests{}) by (request_kind) > 0metricName:APIInflightRequests
2.9 - Telemetry
Telemetry run details of the cluster and scenario
Telemetry Details
We wanted to gather some more insights regarding our Krkn runs that could have been post processed (eg. by a ML model) to have a better understanding about the behavior of the clusters hit by krkn, so we decided to include this as an opt-in feature that, based on the platform (Kubernetes/OCP), is able to gather different type of data and metadata in the time frame of each chaos run.
The telemetry service is currently able to gather several scenario and cluster metadata:
A json named telemetry.json containing:
Chaos run metadata:
the duration of the chaos run
the config parameters with which the scenario has been setup
any recovery time details (applicable to pod scenarios and node scenarios only)
the exit status of the chaos run
Cluster metadata:
Node metadata (architecture, cloud instance type etc.)
Node counts
Number and type of objects deployed in the cluster
Network plugins
Cluster version
A partial/full backup of the prometheus binary logs (currently available on OCP only)
Any firing critical alerts on the cluster
Deploy your own telemetry AWS service
The krkn-telemetry project aims to provide a basic, but fully working example on how to deploy your own Krkn telemetry collection API. We currently do not support the telemetry collection as a service for community users and we discourage to handover your infrastructure telemetry metadata to third parties since may contain confidential infos.
The guide below will explain how to deploy the service automatically as an AWS lambda function, but you can easily deploy it as a flask application in a VM or in any python runtime environment. Then you can use it to store data to use in chaos-ai
telemetry:enabled:False# enable/disables the telemetry collection featureapi_url:https://ulnmf9xv7j.execute-api.us-west-2.amazonaws.com/production#telemetry service endpointusername:username # telemetry service usernamepassword:password # telemetry service passwordprometheus_backup:True# enables/disables prometheus data collectionfull_prometheus_backup:False# if is set to False only the /prometheus/wal folder will be downloaded.backup_threads:5# number of telemetry download/upload threadsarchive_path:/tmp # local path where the archive files will be temporarly storedmax_retries:0# maximum number of upload retries (if 0 will retry forever)run_tag:''# if set, this will be appended to the run folder in the bucket (useful to group the runs)archive_size:500000# the size of the prometheus data archive size in KB. The lower the size of archive is# the higher the number of archive files will be produced and uploaded (and processed by backup_threads# simultaneously).# For unstable/slow connection is better to keep this value low# increasing the number of backup_threads, in this way, on upload failure, the retry will happen only on the# failed chunk without affecting the whole upload.logs_backup:Truelogs_filter_patterns:- "(\\w{3}\\s\\d{1,2}\\s\\d{2}:\\d{2}:\\d{2}\\.\\d+).+"# Sep 9 11:20:36.123425532- "kinit (\\d+/\\d+/\\d+\\s\\d{2}:\\d{2}:\\d{2})\\s+"# kinit 2023/09/15 11:20:36 log- "(\\d{4}-\\d{2}-\\d{2}T\\d{2}:\\d{2}:\\d{2}\\.\\d+Z).+"# 2023-09-15T11:20:36.123425532Z logoc_cli_path:/usr/bin/oc # optional, if not specified will be search in $PATH
Sample output of telemetry
{"telemetry":{"scenarios":[{"start_timestamp":1745343338,"end_timestamp":1745343683,"scenario":"scenarios/network_chaos.yaml","scenario_type":"pod_disruption_scenarios","exit_status":0,"parameters_base64":"","parameters":[{"config":{"execution_type":"parallel","instance_count":1,"kubeconfig_path":"/root/.kube/config","label_selector":"node-role.kubernetes.io/master","network_params":{"bandwidth":"10mbit","latency":"500ms","loss":"50%"},"node_interface_name":null,"test_duration":300,"wait_duration":60},"id":"network_chaos"}],"affected_pods":{"recovered":[],"unrecovered":[],"error":null},"affected_nodes":[],"cluster_events":[]}],"node_summary_infos":[{"count":3,"architecture":"amd64","instance_type":"n2-standard-4","nodes_type":"master","kernel_version":"5.14.0-427.60.1.el9_4.x86_64","kubelet_version":"v1.31.6","os_version":"Red Hat Enterprise Linux CoreOS 418.94.202503121207-0"},{"count":3,"architecture":"amd64","instance_type":"n2-standard-4","nodes_type":"worker","kernel_version":"5.14.0-427.60.1.el9_4.x86_64","kubelet_version":"v1.31.6","os_version":"Red Hat Enterprise Linux CoreOS 418.94.202503121207-0"}],"node_taints":[{"node_name":"prubenda-g-qdcvv-master-0.c.chaos-438115.internal","effect":"NoSchedule","key":"node-role.kubernetes.io/master","value":null},{"node_name":"prubenda-g-qdcvv-master-1.c.chaos-438115.internal","effect":"NoSchedule","key":"node-role.kubernetes.io/master","value":null},{"node_name":"prubenda-g-qdcvv-master-2.c.chaos-438115.internal","effect":"NoSchedule","key":"node-role.kubernetes.io/master","value":null}],"kubernetes_objects_count":{"ConfigMap":530,"Pod":294,"Deployment":69,"Route":8,"Build":1},"network_plugins":["OVNKubernetes"],"timestamp":"2025-04-22T17:35:37Z","health_checks":null,"total_node_count":6,"cloud_infrastructure":"GCP","cloud_type":"self-managed","cluster_version":"4.18.0-0.nightly-2025-03-13-035622","major_version":"4.18","run_uuid":"96348571-0b06-459e-b654-a1bb6fd66239","job_status":true},"critical_alerts":null}
3 - What is krkn-hub?
Background on what is the krkn-hub github repository
Hosts container images and wrapper for running scenarios supported by Krkn, a chaos testing tool for Kubernetes clusters to ensure it is resilient to failures. All we need to do is run the containers with the respective environment variables defined as supported by the scenarios without having to maintain and tweak files!
krkn-operator is a Kubernetes Operator that orchestrates Krkn-based chaos scenarios using Kubernetes as the execution platform instead of Docker/Podman as krknctl does.
Cloud-Native Architecture
krkn-operator is built following cloud-native best practices:
All component interactions happen through Kubernetes Custom Resource Definitions (CRDs)
Fully declarative configuration
Native integration with Kubernetes security model
Important: Multi-Cluster Design
A critical architectural principle of krkn-operator is that the cluster running the operator does NOT execute chaos scenarios against itself. Instead:
The control plane cluster runs krkn-operator and orchestrates chaos execution
Target clusters are where chaos scenarios are actually injected
This design preserves the original Krkn architecture where chaos testing is performed from an external control point
This separation ensures that chaos experiments cannot destabilize the orchestration layer itself.
Security Benefits
One of the major advantages of krkn-operator over previous approaches (krknctl, krkn-hub containers) is enhanced credential security:
Previous Approach (krknctl / krkn-hub)
Users needed direct access to target cluster credentials (kubeconfig files, service account tokens)
Credential sharing made user onboarding/offboarding complex and risky
Each user managed their own credentials, increasing the attack surface
krkn-operator Approach
Target cluster credentials are configured once by the krkn-operator administrator
Users are granted access through the KrknUser CRD, a custom resource that manages user permissions
No cluster credentials are shared with end users
User permissions are managed declaratively through KrknUser resources
Simplified and secure onboarding/offboarding process
INFO
Security Model: Users interact with krkn-operator through CRDs. The operator holds the credentials and executes chaos on their behalf, eliminating the need to distribute sensitive cluster access tokens.
Modular Design
krkn-operator features a modular, extensible architecture that supports integration with various target providers:
Exposes well-defined interfaces for target provider integration operators
Allows extending chaos capabilities to different cluster management platforms
Example: krkn-operator-acm provides integration with Red Hat Advanced Cluster Management (ACM) and Open Cluster Management (OCM)
This design enables organizations to integrate krkn-operator with their existing cluster management infrastructure seamlessly.
Getting Started
Documentation for installation and configuration is coming soon.
4.1 - Installation
Install krkn-operator using Helm
This guide walks you through installing krkn-operator using Helm, the recommended installation method.
Prerequisites
Kubernetes 1.19+ or OpenShift 4.x
Helm 3.0+
A Kubernetes cluster (kind, minikube, or production cluster)
Quick Start (kind/minikube)
Perfect for testing and local development, this minimal installation gets krkn-operator running quickly on kind or minikube.
Latest Version:loading…
The version number is automatically updated in the commands below. For other available versions, see the releases page.
For production deployments, you’ll want to customize the installation with a values.yaml file to ensure high availability, proper resource limits, monitoring integration, and secure external access.
When to Use Each Installation Method
Choose the installation method that matches your environment and requirements:
Method
Use When
Key Features
Quick Start
Testing on kind/minikube, local development, POC
Minimal configuration, port-forward access, no HA
Production (Kubernetes)
Running on standard Kubernetes (EKS, GKE, AKS, self-managed)
Ingress for external access, HA setup, resource limits, monitoring
Production (OpenShift)
Running on OpenShift/OKD clusters
OpenShift Routes instead of Ingress, enhanced security contexts, HA setup
The main differences between production installations are:
Kubernetes can use either:
Gateway API (recommended) - Modern routing standard with powerful features
Ingress (legacy) - Traditional method, still widely supported
OpenShift uses Routes for external access (native OpenShift feature, no additional controller needed)
Production configurations add replica counts, resource limits, pod disruption budgets, and monitoring compared to Quick Start
All production methods support the same chaos scenarios and core functionality—the choice depends on your platform and infrastructure preferences.
Installation on Kubernetes
Kubernetes clusters can expose the web console using either Gateway API (recommended) or Ingress (legacy).
Option 1: Using Gateway API (Recommended)
Gateway API is the modern successor to Ingress and provides more powerful and flexible routing capabilities.
A Gateway resource already deployed (usually managed by cluster admins)
Create a values.yaml file:
# Production values for Kubernetes with Gateway API# Enable web console with Gateway APIconsole:enabled:truegateway:enabled:truegatewayName:krkn-gateway # Name of your existing GatewaygatewayNamespace:""# Optional: if Gateway is in a different namespacehostname:krkn.example.compath:/pathType:PathPrefix# Operator configurationoperator:replicaCount:2resources:requests:cpu:100mmemory:128Milimits:cpu:500mmemory:512Milogging:level:infoformat:json# High availabilitypodDisruptionBudget:enabled:trueminAvailable:1# Monitoring (if using Prometheus)monitoring:enabled:trueserviceMonitor:enabled:trueinterval:30s
Note: Gateway API assumes you have a Gateway resource already configured in your cluster. The chart creates only the HTTPRoute that attaches to that Gateway.
Option 2: Using Ingress (Legacy)
If your cluster doesn’t support Gateway API yet, you can use traditional Ingress:
# Production values for Kubernetes with Ingress# Enable web console with Ingressconsole:enabled:trueingress:enabled:trueclassName:nginx # or your ingress controllerhostname:krkn.example.comannotations:cert-manager.io/cluster-issuer:letsencrypt-prodtls:- secretName:krkn-tlshosts:- krkn.example.com# Operator configurationoperator:replicaCount:2resources:requests:cpu:100mmemory:128Milimits:cpu:500mmemory:512Milogging:level:infoformat:json# High availabilitypodDisruptionBudget:enabled:trueminAvailable:1# Monitoring (if using Prometheus)monitoring:enabled:trueserviceMonitor:enabled:trueinterval:30s
OpenShift uses Routes instead of Ingress. Create an OpenShift-specific values.yaml:
# Production values for OpenShift# Enable web console with Routeconsole:enabled:trueroute:enabled:truehostname:krkn.apps.cluster.example.comtls:termination:edge# Operator configurationoperator:replicaCount:2resources:requests:cpu:100mmemory:128Milimits:cpu:500mmemory:512MisecurityContext:runAsNonRoot:trueseccompProfile:type:RuntimeDefault# High availabilitypodDisruptionBudget:enabled:trueminAvailable:1
ACM Integration: When ACM is enabled, krkn-operator-acm will automatically discover and manage ACM-controlled clusters. See the ACM Integration section in Configuration for more details.
This guide walks you through configuring target Kubernetes or OpenShift clusters where you want to run chaos engineering scenarios.
Overview
Before running chaos experiments, you need to add one or more target clusters to the Krkn Operator. Target clusters are the Kubernetes/OpenShift clusters where chaos scenarios will be executed. You can add multiple target clusters and manage them through the web console.
INFO
Administrator Access Required: Adding and managing target clusters requires administrator privileges. Only users with admin access can configure target clusters through the Settings menu.
Accessing Cluster Configuration
Step 1: Open Admin Settings
Log in to the Krkn Operator Console and click on your profile in the top-right corner. Select Admin Settings from the dropdown menu.
INFO
Admin Only: If you don’t see the “Admin Settings” option, you don’t have administrator privileges. Contact your Krkn Operator administrator to request access or to add target clusters on your behalf.
Step 2: Navigate to Cluster Targets
In the Admin Settings page, click on the Cluster Targets tab in the left sidebar. This will show you a list of all configured target clusters (if any).
Adding a New Target Cluster
Step 3: Open the Add Target Dialog
Click the Add Target button in the top-right corner of the Cluster Targets page. This will open the “Add New Target” dialog.
Step 4: Enter Cluster Information
You’ll need to provide:
Cluster Name (required): A friendly name to identify this cluster (e.g., “Production-US-East”, “Dev-Cluster”, “OpenShift-QA”)
Authentication Type (required): Choose one of three authentication methods:
Kubeconfig - Full kubeconfig file (recommended)
Service Account Token - Token-based authentication
Username/Password - Basic authentication (for clusters that support it)
Authentication Methods
The Krkn Operator supports three different ways to authenticate to target clusters. Choose the method that best fits your cluster’s security configuration.
Method 1: Kubeconfig (Recommended)
This is the most common and recommended method. It uses a complete kubeconfig file to authenticate to the target cluster.
When to use:
You have direct access to the cluster’s kubeconfig file
You want to authenticate with certificates or tokens defined in the kubeconfig
The cluster supports standard Kubernetes authentication
How to configure:
Select Kubeconfig as the Authentication Type
Obtain the kubeconfig file for your target cluster:
# For most Kubernetes clusterskubectl config view --flatten --minify > target-cluster.kubeconfig
# For OpenShift clustersoc login https://api.cluster.example.com:6443
oc config view --flatten > target-cluster.kubeconfig
Open the kubeconfig file in a text editor and copy its entire contents
Paste the kubeconfig content into the Kubeconfig text area in the dialog
Click Create
INFO
Automatic Encoding: The kubeconfig content will be automatically base64-encoded and stored securely. You don’t need to encode it manually.
Use this method if you want to authenticate using a Kubernetes Service Account token.
When to use:
You want fine-grained RBAC control over what the operator can do
You’re following a zero-trust security model
You want to create a dedicated service account for chaos testing
How to configure:
Create a service account in the target cluster with appropriate permissions:
# Create service accountkubectl create serviceaccount krkn-operator -n krkn-system
# Create ClusterRole with necessary permissionskubectl create clusterrolebinding krkn-operator-admin \
--clusterrole=cluster-admin \
--serviceaccount=krkn-system:krkn-operator
# Get the service account tokenkubectl create token krkn-operator -n krkn-system --duration=8760h
In the “Add New Target” dialog:
Enter a Cluster Name
Select Service Account Token as the Authentication Type
Enter the API Server URL (e.g., https://api.cluster.example.com:6443)
Paste the Service Account Token you generated
(Optional) Provide CA Certificate data if your cluster uses a self-signed or custom Certificate Authority
Click Create
About CA Certificate (Optional):
The CA Certificate field is optional and only needed in specific scenarios:
When to provide it: If your cluster uses a self-signed certificate or a custom/private Certificate Authority (CA) that is not trusted by default
When to skip it: If your cluster uses certificates from a public CA (like Let’s Encrypt, DigiCert, etc.) or standard cloud provider certificates
What it does: The CA certificate allows the Krkn Operator to verify the identity of your cluster’s API server and establish a secure TLS connection
How to get it: Extract the CA certificate from your cluster’s kubeconfig file (the certificate-authority-data field, base64-decoded) or from your cluster administrator
Example of extracting CA certificate from kubeconfig:
# Extract and decode CA certificatekubectl config view --raw -o jsonpath='{.clusters[0].cluster.certificate-authority-data}'| base64 -d > ca.crt
INFO
Token Expiration: Service account tokens can expire. If your cluster targets stop working, check if the token has expired and generate a new one.
Method 3: Username/Password
Use basic authentication with a username and password. This method is only supported by clusters that have basic auth enabled.
When to use:
Your cluster supports basic authentication
You’re testing in a development environment
You have credentials for a user with appropriate permissions
How to configure:
In the “Add New Target” dialog:
Enter a Cluster Name
Select Username/Password as the Authentication Type
Enter the API Server URL (e.g., https://api.cluster.example.com:6443)
Enter your Username
Enter your Password
(Optional) Provide CA Certificate data if your cluster uses a self-signed or custom Certificate Authority
Click Create
About CA Certificate (Optional):
Same as with token authentication, the CA Certificate is optional:
When needed: Only if your cluster uses self-signed certificates or a custom/private Certificate Authority
When to skip: If using public CA certificates or standard cloud provider setups
Purpose: Enables secure TLS verification when connecting to the cluster’s API server
INFO
Security Warning: Basic authentication is less secure than certificate-based or token-based authentication. It’s recommended only for development and testing environments. Most production Kubernetes/OpenShift clusters have basic auth disabled by default.
Verifying Target Cluster
After adding a target cluster, the Krkn Operator will attempt to connect to it and verify the credentials.
Successful Configuration
If the cluster is configured correctly, you’ll see it appear in the Cluster Targets list with a green status indicator. You can now use this cluster as a target for chaos scenarios.
Troubleshooting Connection Issues
If the cluster connection fails, check the following:
Issue
Possible Cause
Solution
Connection timeout
Incorrect API server URL
Verify the API server URL is correct and accessible from the operator
Authentication failed
Invalid credentials
Re-check your kubeconfig, token, or username/password
Certificate error
CA certificate mismatch
Provide the correct CA certificate for clusters with custom CAs
Permission denied
Insufficient RBAC permissions
Ensure the service account or user has cluster-admin or necessary permissions
Network unreachable
Firewall or network policy
Ensure the Krkn Operator can reach the target cluster’s API server
You can view detailed error messages in the operator logs:
Navigate to Admin Settings → Cluster Targets to see all configured target clusters. Each cluster shows:
Cluster name
Connection status
Last verified time
Authentication method used
Editing a Target Cluster
To modify an existing target cluster:
Click the Edit button next to the cluster in the list
Update the cluster name or authentication credentials
Click Save
Removing a Target Cluster
To remove a target cluster:
Click the Delete button next to the cluster in the list
Confirm the deletion
INFO
Active Scenarios: If you delete a target cluster that has running chaos scenarios, those scenarios will be terminated immediately.
Required Permissions
The service account or user used to connect to target clusters needs the following permissions:
Minimum RBAC Permissions
For most chaos scenarios, the operator needs cluster-admin privileges or at least these permissions:
apiVersion:rbac.authorization.k8s.io/v1kind:ClusterRolemetadata:name:krkn-operator-target-accessrules:# Pod chaos scenarios- apiGroups:[""]resources:["pods","pods/log","pods/exec"]verbs:["get","list","watch","create","delete","deletecollection"]# Node chaos scenarios- apiGroups:[""]resources:["nodes"]verbs:["get","list","watch","update","patch"]# Deployment/StatefulSet/DaemonSet scenarios- apiGroups:["apps"]resources:["deployments","statefulsets","daemonsets","replicasets"]verbs:["get","list","watch","update","patch","delete"]# Service and networking scenarios- apiGroups:[""]resources:["services","endpoints"]verbs:["get","list","watch","create","update","delete"]- apiGroups:["networking.k8s.io"]resources:["networkpolicies"]verbs:["get","list","watch","create","update","delete"]# Namespace scenarios- apiGroups:[""]resources:["namespaces"]verbs:["get","list","watch"]# Job creation for scenario execution- apiGroups:["batch"]resources:["jobs"]verbs:["get","list","watch","create","update","delete"]# Events for monitoring- apiGroups:[""]resources:["events"]verbs:["get","list","watch"]
INFO
OpenShift Clusters: For OpenShift clusters, you may also need permissions for OpenShift-specific resources like Route, DeploymentConfig, and Project.
Best Practices
Use Dedicated Service Accounts: Create a dedicated service account in each target cluster specifically for chaos testing. This makes it easier to audit and control permissions.
Rotate Credentials Regularly: Periodically rotate kubeconfig files and service account tokens to maintain security.
Test Connectivity First: After adding a target cluster, run a simple non-destructive scenario to verify connectivity before running destructive chaos tests.
Organize by Environment: Use clear naming conventions like prod-us-east-1, staging-eu-west, dev-local to easily identify clusters.
Limit Production Access: Consider restricting production cluster access to specific users or requiring additional approval workflows.
Monitor Operator Logs: Regularly check operator logs for authentication errors or connection issues.
Advanced Cluster Management (ACM) and Open Cluster Management (OCM) are multi-cluster management platforms that allow you to manage multiple Kubernetes and OpenShift clusters from a single hub cluster. ACM/OCM provides:
Application deployment across clusters - Deploy applications to multiple clusters with policies
Governance and compliance - Apply security and compliance policies across your fleet
Observability - Monitor metrics, logs, and alerts from all managed clusters
How ACM Integration Works
When the ACM integration is enabled in the Krkn Operator, the krkn-operator-acm component automatically:
Discovers all managed clusters registered with your ACM/OCM hub
Imports them as chaos testing targets into the Krkn Operator console
Keeps the cluster list synchronized as new clusters are added or removed from ACM
Authenticates automatically using ACM’s ManagedServiceAccount resources—no manual credential management required
INFO
Zero Configuration: Once ACM integration is enabled, you don’t need to manually add clusters, provide kubeconfig files, or manage authentication tokens. The operator handles everything automatically through ACM’s native authentication mechanisms.
Benefits of ACM Integration
Feature
Manual Configuration
ACM Integration
Cluster Discovery
Manual - add each cluster individually
Automatic - all ACM-managed clusters
Credential Management
Manual - maintain tokens/kubeconfig per cluster
Automatic - uses ManagedServiceAccount
Cluster Updates
Manual - update credentials when they change
Automatic - ACM handles rotation
New Clusters
Manual - must add explicitly
Automatic - discovered immediately
Security
Per-cluster authentication
Centralized ACM RBAC with fine-grained control
Enabling ACM Integration
Step 1: Install with ACM Enabled
To enable ACM integration, install the Krkn Operator with the ACM component enabled via Helm:
For complete installation instructions and additional configuration options, see the Installation Guide.
INFO
Hub Cluster Requirement: The Krkn Operator must be installed on the same cluster where ACM/OCM is running (the hub cluster). It will then discover all spoke clusters managed by that ACM instance.
Step 2: Verify ACM Component
After installation, verify that the ACM component is running:
kubectl get pods -n krkn-operator-system -l app.kubernetes.io/component=acm
# Expected output:# NAME READY STATUS RESTARTS AGE# krkn-operator-acm-xxxxxxxxx-xxxxx 1/1 Running 0 2m
Check the ACM component logs to see cluster discovery in action:
kubectl logs -n krkn-operator-system -l app.kubernetes.io/component=acm
# You should see logs like:# INFO Discovered 5 managed clusters from ACM# INFO Synced cluster: production-us-east# INFO Synced cluster: staging-eu-west
One of the most powerful features of ACM integration is the ability to use ManagedServiceAccounts for authentication to target clusters. This provides fine-grained, per-cluster security control.
What are ManagedServiceAccounts?
ManagedServiceAccounts are a feature of OCM/ACM that allows the hub cluster to create and manage service accounts on spoke clusters. Instead of using a single highly-privileged service account (like open-cluster-management-agent-addon-application-manager), you can create dedicated service accounts with custom RBAC permissions for each cluster.
Configuring Per-Cluster Service Accounts
Navigate to Admin Settings → Provider Configuration → ACM to configure which ManagedServiceAccount to use for each cluster:
For each managed cluster, you can:
Select a ManagedServiceAccount: Choose from existing ManagedServiceAccounts created on that cluster
Customize permissions per cluster: Each cluster can use a different service account with different RBAC permissions
Apply the configuration: The Krkn Operator will use this service account for all chaos testing operations on that cluster
Why Use Custom ManagedServiceAccounts?
By default, ACM uses the open-cluster-management-agent-addon-application-manager service account, which has cluster-admin privileges on all spoke clusters. While convenient, this violates the principle of least privilege.
Using custom ManagedServiceAccounts provides:
Enhanced Security:
Least privilege access: Grant only the permissions needed for chaos testing (e.g., pod deletion, network policy creation) rather than full cluster-admin
Per-cluster customization: Production clusters can have more restrictive permissions than dev/test clusters
Audit trail: Each cluster has a dedicated service account, making it easier to track and audit chaos testing activities
Flexibility:
Environment-specific policies: Different permissions for prod, staging, and dev environments
Scenario-specific accounts: Create different service accounts for different types of chaos scenarios
Compliance: Meet security and compliance requirements by limiting operator privileges
Example: Creating a Custom ManagedServiceAccount
Create a ManagedServiceAccount with limited chaos testing permissions:
apiVersion:authentication.open-cluster-management.io/v1beta1kind:ManagedServiceAccountmetadata:name:krkn-chaos-operatornamespace:cluster-prod-us-east # ManagedCluster namespacespec:rotation:{}---apiVersion:rbac.authorization.k8s.io/v1kind:ClusterRolemetadata:name:krkn-chaos-limitedrules:# Pod chaos - read and delete only- apiGroups:[""]resources:["pods"]verbs:["get","list","watch","delete"]# Node chaos - read and cordon/drain only- apiGroups:[""]resources:["nodes"]verbs:["get","list","watch","update","patch"]# Network policies - create and delete- apiGroups:["networking.k8s.io"]resources:["networkpolicies"]verbs:["get","list","create","delete"]# No destructive operations on critical resources# (no namespace deletion, no service account manipulation, etc.)---apiVersion:rbac.authorization.k8s.io/v1kind:ClusterRoleBindingmetadata:name:krkn-chaos-limited-bindingroleRef:apiGroup:rbac.authorization.k8s.iokind:ClusterRolename:krkn-chaos-limitedsubjects:- kind:ServiceAccountname:krkn-chaos-operatornamespace:open-cluster-management-agent-addon
Apply this to the ACM hub cluster, and the ManagedServiceAccount will be created on the spoke cluster automatically. You can then select it in the Provider Configuration UI.
INFO
Security Best Practice: Create different ManagedServiceAccounts for different environments. For example:
krkn-prod with minimal permissions (only non-destructive scenarios)
krkn-staging with moderate permissions (most scenarios)
krkn-dev with full chaos permissions (all scenarios)
Automatic Cluster Synchronization
Once ACM integration is enabled and configured, the Krkn Operator automatically:
Syncs cluster list every 60 seconds (configurable)
Adds new clusters as they’re imported into ACM
Removes clusters that are deleted from ACM
Updates cluster status based on ACM health checks
Rotates credentials automatically when ManagedServiceAccount tokens are refreshed
You can view all ACM-discovered clusters in the Cluster Targets page. They will be marked with an ACM badge to distinguish them from manually configured clusters.
Troubleshooting ACM Integration
ACM Component Not Starting
If the ACM component fails to start, check:
# Check pod statuskubectl get pods -n krkn-operator-system -l app.kubernetes.io/component=acm
# View logskubectl logs -n krkn-operator-system -l app.kubernetes.io/component=acm
# Common issues:# - ACM/OCM not installed on the hub cluster# - Missing RBAC permissions for the operator to read ManagedCluster resources# - Network policies blocking communication
No Clusters Discovered
If the ACM component is running but no clusters appear:
Learn how to run chaos scenarios with Krkn Operator
This guide walks you through the process of running chaos engineering scenarios using the Krkn Operator web interface.
Overview
The Krkn Operator provides an intuitive web interface for executing chaos scenarios against your Kubernetes clusters. The workflow is straightforward: select your target clusters, choose a scenario registry, pick a scenario, configure it, and launch the experiment. The operator handles all the complexity of scheduling, execution, and monitoring.
Step 1: Starting a Scenario Run
From the Krkn Operator home page, you’ll see the main dashboard with an overview of your configured targets and recent scenario runs.
To begin running a chaos scenario, click the Run Scenario button. This will launch the scenario configuration wizard that guides you through the setup process.
Step 2: Selecting Target Clusters
The first step in the wizard is selecting which clusters you want to target with your chaos experiment.
One of the powerful features of Krkn Operator is its ability to run scenarios across multiple clusters simultaneously. If you have configured multiple target providers (such as manual targets and ACM-managed clusters), all available clusters will be presented in a unified view.
Key capabilities:
Multi-cluster selection: Select one or more target clusters to run the same scenario across multiple environments
Unified view: All clusters from all configured providers (manual targets, ACM, etc.) are displayed together
Parallel execution: When multiple targets are selected, the scenario will execute on all of them concurrently
This is particularly useful for testing:
Consistency of behavior across environments (dev, staging, production)
Regional cluster resilience
Multi-tenant cluster configurations
Different Kubernetes distributions or versions
Step 3: Selecting a Scenario Registry
After selecting your target clusters, you’ll choose where to pull the chaos scenario container images from.
Krkn Operator supports two types of registries:
Quay.io (Default)
The default option is the official Krkn Chaos registry on Quay.io, which contains all the pre-built, tested chaos scenarios maintained by the Krkn community. This is the recommended choice for most users as it provides:
Immediate access to 20+ chaos scenarios
Regular updates and new scenario releases
Pre-validated and tested scenario images
Private Registry
For organizations with specific requirements, you can configure a private container registry. This is useful when you need to:
Run custom or modified chaos scenarios
Operate in restricted network environments
Maintain full control over scenario versions
Meet compliance or security requirements
INFO
Air-Gapped and Disconnected Environments: Krkn Operator uses the OCI registry itself as the backend for scenario metadata through OCI registry APIs. This means that in a private registry configuration, the operator can function completely in disconnected or air-gapped environments without requiring external connectivity. All scenario definitions, metadata, and images are stored and retrieved from your private registry.
To use a private registry, you’ll need to:
Configure the private registry in the Configuration section
Push the Krkn scenario images to your private registry
Ensure the operator has proper authentication credentials
Step 4: Selecting a Chaos Scenario
After choosing your registry, you’ll be presented with a list of available chaos scenarios to run against your target clusters.
The scenario selection page displays all available chaos scenarios from the chosen registry. Each scenario card shows:
Scenario name and description
Scenario type (pod, node, network, etc.)
Version information
Browse through the available scenarios and select the one that matches your chaos engineering objectives. For detailed information about each scenario and what it does, refer to the Scenarios documentation.
Step 5: Configuring Scenario Parameters
Once you’ve selected a scenario, you’ll move to the configuration phase where you can customize the scenario’s behavior to match your testing requirements.
Mandatory Parameters
Mandatory parameters are scenario-specific settings that must be configured before running the chaos experiment. When a scenario has mandatory parameters, you cannot proceed without providing values for them.
Important notes:
Required when present: If a scenario displays mandatory parameters, you must fill them in—there are no defaults
Not all scenarios have them: Some scenarios can run without any mandatory configuration
Scenario-specific: Different scenarios have different mandatory parameters based on what they’re testing
If a scenario has no mandatory parameters, it can technically run with just the built-in defaults. However, running with defaults alone may not produce the desired chaos effect on your cluster, as the scenario won’t be tailored to your specific environment and applications.
Best Practice: Even when mandatory parameters aren’t present, review the optional parameters to ensure the scenario targets the right resources and behaves as expected in your environment. For example, a pod deletion scenario might run with defaults, but you’ll want to configure it to target your specific application namespace and workloads.
Optional Parameters
Optional parameters provide fine-grained control over the scenario’s behavior. These parameters:
Allow you to customize the chaos experiment beyond the basic configuration
Are entirely optional—scenarios run perfectly fine without setting them
Global options control the behavior of the Krkn framework itself, not the specific scenario. These settings enable integration with observability and monitoring tools:
Elasticsearch integration: Send scenario metrics and results to Elasticsearch
Prometheus integration: Export chaos metrics to Prometheus
Alert collection: Capture and analyze alerts triggered during the chaos experiment
Custom dashboards: Configure metrics export for custom monitoring dashboards
Cerberus integration: Enable health monitoring during chaos runs
INFO
Default Value Handling: Global options are only applied if you modify them from their default values in the form. If you leave a global option at its default setting, it will not be included in the scenario configuration. This prevents unnecessary configuration bloat and ensures only intentional customizations are applied.
After configuring all parameters, click Run Scenario to launch the chaos experiment.
Monitoring Scenario Runs
Once you launch a scenario, you can monitor its execution in real-time through the Krkn Operator web interface.
Active Scenarios Dashboard
The home page displays all active scenario runs across all target clusters. Each scenario card shows:
Scenario name and type
Target cluster(s) where it’s running
Current status (running, completed, failed)
Start time and duration
User who initiated the run
From this dashboard, you can:
View all running experiments at a glance
Click on a scenario to see detailed execution information
Stop or cancel running scenarios (if you have permissions)
Scenario Run Details
Clicking on a running scenario opens the detailed view, which provides:
Real-time container logs: Watch the chaos scenario execute with live log streaming
Execution timeline: See when the scenario started, its current phase, and expected completion
Configuration details: Review the parameters that were used for this run
Target information: Verify which cluster(s) the scenario is affecting
Status updates: Real-time status changes as the scenario progresses through its phases
The live log streaming is particularly useful for:
Debugging scenario failures
Understanding what the chaos experiment is currently doing
Verifying that the chaos is being injected as expected
Capturing evidence for post-experiment analysis
User Permissions and Visibility
Role-Based Access Control: Scenario visibility and management capabilities depend on your user role.
Administrator users can:
View all scenario runs from all users
Manage any running scenario
Cancel experiments initiated by any user
Regular users can:
View only their own scenario runs
Manage only scenarios they initiated
Scenarios started by other users are not visible to them
This role-based access control ensures that teams can work independently while administrators maintain oversight and control of all chaos engineering activities.
What’s Next?
Now that you understand how to run and monitor chaos scenarios with Krkn Operator, you might want to:
Krknctl is a tool designed to run and orchestrate krkn chaos scenarios utilizing
container images from the krkn-hub.
Its primary objective is to streamline the usage of krkn by providing features like:
Command auto-completion
Input validation
Scenario descriptions and detailed instructions
and much more, effectively abstracting the complexities of the container environment.
This allows users to focus solely on implementing chaos engineering practices without worrying about runtime complexities.
5.1 - Usage
Commands:
Commands are grouped by action and may include one or more subcommands to further define the specific action.
list <subcommand>:
available:
Builds a list of all the available scenarios in krkn-hub
% krknctl list available
Name
Size
Digest
Last Modified
network-chaos
**
sha256:**
2025-01-01 00:00:00+0000 +0000
service-disruption-scenarios
**
sha256:**
2025-01-01 00:00:00+0000 +0000
node-memory-hog
**
sha256:**
2025-01-01 00:00:00+0000 +0000
application-outages
**
sha256:**
2025-01-01 00:00:00+0000 +0000
node-cpu-hog
**
sha256:**
2025-01-01 00:00:00+0000 +0000
time-scenarios
**
sha256:**
2025-01-01 00:00:00+0000 +0000
node-scenarios
**
sha256:**
2025-01-01 00:00:00+0000 +0000
service-hijacking
**
sha256:**
2025-01-01 00:00:00+0000 +0000
pvc-scenarios
**
sha256:**
2025-01-01 00:00:00+0000 +0000
chaos-recommender
**
sha256:**
2025-01-01 00:00:00+0000 +0000
syn-flood
**
sha256:**
2025-01-01 00:00:00+0000 +0000
container-scenarios
**
sha256:**
2025-01-01 00:00:00+0000 +0000
pod-network-chaos
**
sha256:**
2025-01-01 00:00:00+0000 +0000
pod-scenarios
**
sha256:**
2025-01-01 00:00:00+0000 +0000
node-io-hog
**
sha256:**
2025-01-01 00:00:00+0000 +0000
power-outages
**
sha256:**
2025-01-01 00:00:00+0000 +0000
zone-outages
**
sha256:**
2025-01-01 00:00:00+0000 +0000
dummy-scenario
**
sha256:**
2025-01-01 00:00:00+0000 +0000
running:
Builds a list of all the scenarios currently running in the system. The scenarios are filtered based on the tool’s naming conventions.
describe <scenario name>:
Describes the specified scenario giving to the user an overview of what are the actions that the scenario will perform on
the target system. It will also show all the available flags that the scenario will accept as input to modify the behaviour
of the scenario.
run <scenario name> [flags]:
Will run the selected scenarios with the specified options
Tip
Because the kubeconfig file may reference external certificates stored on the filesystem,
which won’t be accessible once mounted inside the container, it will be automatically
copied to the directory where the tool is executed. During this process, the kubeconfig
will be flattened by encoding the certificates in base64 and inlining them directly into the file.
Tip
if you want interrupt the scenario while running in attached mode simply hit CTRL+C the
container will be killed and the scenario interrupted immediately
Common flags:
Flag
Description
–kubeconfig
kubeconfig path (if empty will default to ~/.kube/config)
–detached
will run the scenario in detached mode (background) will be possible to reattach the tool to the container logs with the attach command
–alerts-profile
will mount in the container a custom alert profile (check krkn documentation for further infos)
–metrics-profile
will mount in the container scenario a custom metrics profile (check krkn documentation for further infos)
graph <subcommand>:
In addition to running individual scenarios, the tool can also orchestrate
multiple scenarios in serial, parallel, or mixed execution by utilizing a
scenario dependency graph resolution algorithm.
scaffold <scenario names> [flags]:
Scaffolds a basic execution plan structure in json format for all the scenario names provided.
The default structure is a serial execution with a root node and each node depends on the
other starting from the root. Starting from this configuration it is possible to define complex
scenarios changing the dependencies between the nodes.
Will be provided a random id for each scenario and the dependency will be defined through the
depends_on attribute. The scenario id is not strictly dependent on the scenario type so it’s
perfectly legit to repeat the same scenario type (with the same or different attributes) varying the
scenario Id and the dependencies accordingly.
will generate an execution plan (serial) containing all the available options for each of the scenarios mentioned with default values
when defined, or a description of the content expected for the field.
Note
Any graph configuration is supported except cycles (self dependencies or transitive)
Supported flags:
Flag
Description
–global-env
if set this flag will add global environment variables to each scenario in the graph
run <json execution plan path> [flags]:
It will display the resolved dependency graph, detailing all the scenarios executed at each dependency step, and will instruct
the container runtime to execute the krkn scenarios accordingly.
Note
Since multiple scenarios can be executed within a single running plan, the output is redirected
to files in the directory where the command is run. These files are named using the following
format: krknctl---.log.
Supported flags:
Flag
Description
–kubeconfig
kubeconfig path (if empty will default to ~/.kube/config)
–alerts-profile
will mount in the container a custom alert profile (check krkn documentation for further infos)
–metrics-profile
will mount in the container scenario a custom metrics profile (check krkn documentation for further infos)
–exit-on-error
if set this flag will the workflow will be interrupted and the tool will exit with a status greater than 0
Supported graph configurations:
Serial execution:
All the nodes depend on each other building a chain, the execution will start from the last item of the chain.
Mixed execution:
The graph is structured in different “layers” so the execution will happen step-by-step executing all the scenarios of the
step in parallel and waiting the end
Parallel execution:
To achieve full parallel execution, where each step can run concurrently (if it involves multiple scenarios),
the approach is to use a root scenario as the entry point, with several other scenarios dependent on it.
While we could have implemented a completely new command to handle this, doing so would have introduced additional
code to support what is essentially a specific case of graph execution.
Instead, we developed a scenario called dummy-scenario. This scenario performs no actual actions but simply pauses
for a set duration. It serves as an ideal root node, allowing all dependent nodes to execute in parallel without adding
unnecessary complexity to the codebase.
random <subcommand>
Random orchestration can be used to test parallel scenario generating random graphs from a set of preconfigured scenarios.
Differently from the graph command, the scenarios in the json plan don’t have dependencies between them since the dependencies
are generated at runtime.
This is might be also helpful to run multiple chaos scenarios at large scale.
scaffold <scenario names> [flags]
Will create the structure for a random plan execution, so without any dependency between the scenarios. Once properly configured this can
be used as a seed to generate large test plans for large scale tests.
This subcommand supports base scaffolding mode by allowing users to specify desired scenario names or generate a plan file of any size using pre-configured scenarios as a template (or seed). This mode is extensively covered in the scale testing section.
Supported flags:
Flag
Description
–global-env
if set this flag will add global environment variables to each scenario in the graph
–number-of-scenarios
the number of scenarios that will be created from the template file
–seed-file
template file with already configured scenarios used to generate the random test plan
run <json execution plan path> [flags]
Supported flags:
Flag
Description
–alerts-profile
custom alerts profile file path
–exit-on-error
if set this flag will the workflow will be interrupted and the tool will exit with a status greater than 0
–graph-dump
specifies the name of the file where the randomly generated dependency graph will be persisted
–kubeconfig
kubeconfig path (if not set will default to ~/.kube/config)
–max-parallel
maximum number of parallel scenarios
–metrics-profile
custom metrics profile file path
–number-of-scenarios
allows you to specify the number of elements to select from the execution plan
attach <scenario ID>:
If a scenario has been executed in detached mode or through a graph plan and you want to attach to the container
standard output this command comes into help.
Tip
to interrupt the output hit CTRL+C, this won’t interrupt the container, but only the output
Tip
if shell completion is enabled, pressing TAB twice will display a list of running
containers along with their respective IDs, helping you select the correct one.
clean:
will remove all the krkn containers from the container runtime, will delete all the kubeconfig files
and logfiles created by the tool in the current folder.
query-status <container Id or Name> [--graph <graph file path>]:
The tool will query the container platform to retrieve information about a container by its name or ID if the --graph
flag is not provided. If the --graph flag is set, it will instead query the status of all container names
listed in the graph file. When a single container name or ID is specified,
the tool will exit with the same status as that container.
Tip
This function can be integrated into CI/CD pipelines to halt execution if the chaos run encounters any failure.
visualize [flags]:
Deploys krkn-visualize — a Grafana dashboard — to the
current Kubernetes cluster. The command pulls and runs the quay.io/krkn-chaos/krkn-visualize:latest
container image via the local container runtime, wiring up Elasticsearch and an optional Prometheus datasource.
Tip
Like the run command, the kubeconfig file is automatically flattened and mounted into the container,
so external certificate references are resolved before the container starts.
To tear down an existing deployment, pass the --delete flag (no password required):
krknctl visualize --delete
Supported flags:
Flag
Default
Description
--es-url
Elasticsearch URL
--es-username
Elasticsearch username
--es-password
Elasticsearch password (masked in output)
--prometheus-url
Prometheus URL for the datasource (optional)
--prometheus-bearer-token
Prometheus bearer token for authentication (masked in output, optional)
--namespace
krkn-visualize
Kubernetes namespace to deploy into
--grafana-password
``
Grafana admin password, required other than when using –delete (masked in output)
--kubectl
kubectl
kubectl binary to use (e.g. oc for OpenShift)
--kubeconfig
~/.kube/config
kubeconfig path
--delete
false
Delete an existing krkn-visualize deployment
Running krknctl on a disconnected environment with a private registry
If you’re using krknctl in a disconnected environment, you can mirror the desired krkn-hub images to your private registry and configure krknctl to use that registry as the backend. Krknctl supports this through global flags or environment variables.
Private registry global flags
Flag
Environment Variable
Description
–private-registry
KRKNCTL_PRIVATE_REGISTRY
private registry URI (eg. quay.io, without any protocol schema prefix)
–private-registry-insecure
KRKNCTL_PRIVATE_REGISTRY_INSECURE
uses plain HTTP instead of TLS
–private-registry-password
KRKNCTL_PRIVATE_REGISTRY_PASSWORD
private registry password for basic authentication
–private-registry-scenarios
KRKNCTL_PRIVATE_REGISTRY_SCENARIOS
private registry krkn scenarios image repository
–private-registry-skip-tls
KRKNCTL_PRIVATE_REGISTRY_SKIP_TLS
skips tls verification on private registry
–private-registry-token
KRKNCTL_PRIVATE_REGISTRY_TOKEN
private registry identity token for token based authentication
-private-registry-username
KRKNCTL_PRIVATE_REGISTRY_USERNAME
private registry username for basic authentication
Note
Not all options are available on every platform due to limitations in the container runtime platform SDK:
Podman
Token authentication is not supported
Docker
Skip TLS verfication cannot be done by CLI, docker daemon needs to be configured on that purpose please follow the documentation
Example: Running krknctl on quay.io private registry
Note
This example will run only on Docker since the token authentication is not yet implemented on the podman SDK
I will use for that example an invented private registry on quay.io: my-quay-user/krkn-hub
mirror some krkn-hub scenarios on a private registry on quay.io
krknctl \
--private-registry quay.io \
--private-registry-scenarios my-quay-user/krkn-hub \
--private-registry-token <your token obtained in the previous step> \
list available
your images should be listed on the console
Note
To make krknctl commands more concise, it’s more convenient to export the corresponding environment variables instead of prepending flags to every command. The relevant variables are:
KRKNCTL_PRIVATE_REGISTRY
KRKNCTL_PRIVATE_REGISTRY_SCENARIOS
KRKNCTL_PRIVATE_REGISTRY_TOKEN
5.2 - Randomized chaos testing
The random subcommand is valuable for generating chaos tests on a large scale with ease and speed. The random scaffold command, when used with the --seed-file and --number-of-scenarios flags, allows you to expand a pre-existing random or graph plan as a template (or seed). The tool randomly distributes scenarios from the seed-file to meet the specified number-of-scenarios. The resulting output is compatible exclusively with the random run command, which generates a random graph from it.
Warning
graph scaffolded scenarios can serve as input for random scaffold --seed-file and random run, as dependencies are simply ignored. However, the reverse is not true. To address this, graphs generated by the random run command are saved (with the path and file name configurable via the --graph-dump flag) and can be replayed using the graph run command.
Example
Let’s start from the following chaos test graph called graph.json:
{"application-outages-1-1":{"image":"containers.krkn-chaos.dev/krkn-chaos/krkn-hub:application-outages","name":"application-outages","env":{"BLOCK_TRAFFIC_TYPE":"[Ingress, Egress]","DURATION":"30","NAMESPACE":"dittybopper","POD_SELECTOR":"{app: dittybopper}","WAIT_DURATION":"1","KRKN_DEBUG":"True"},},"application-outages-1-2":{"image":"containers.krkn-chaos.dev/krkn-chaos/krkn-hub:application-outages","name":"application-outages","env":{"BLOCK_TRAFFIC_TYPE":"[Ingress, Egress]","DURATION":"30","NAMESPACE":"default","POD_SELECTOR":"{app: nginx}","WAIT_DURATION":"1","KRKN_DEBUG":"True"},"depends_on":"root-scenario"},"root-scenario-1":{"_comment":"I'm the root Node!","image":"containers.krkn-chaos.dev/krkn-chaos/krkn-hub:dummy-scenario","name":"dummy-scenario","env":{"END":"10","EXIT_STATUS":"0"}}}
Note
The larger the seed file, the more diverse the resulting output file will be.
Step 1: let’s expand it to 100 scenarios with the command krknctl random scaffold --seed-file graph.json --number-of-scenarios 100 > big-random-graph.json
This will produce a file containing 100 compiled replicating the three scenarios above a random amount of times per each:
Step 2: run the randomly generated chaos test using the command krknctl random run big-random-graph.json --max-parallel 50 --graph-dump big-graph.json. This instructs krknctl to orchestrate the scenarios in the specified file within a graph, allowing up to 50 scenarios to run in parallel per step, while ensuring all scenarios listed in the JSON input file are executed.The generated random graph will be saved to a file named big-graph.json.
Warning
The max-parallel value should be tuned according to machine resources, as it determines the number of parallel krkn instances executed simultaneously on the local machine via containers on podman or docker
Step 3: if you found the previous chaos run disruptive and you want to re-execute it periodically you can store the big-graph.jsonsomewhere and replay it with the command krknctl graph run big-graph.json
6 - Krkn Dashboard
Web-based UI to run and observe Krkn chaos scenarios, with Elasticsearch and Grafana integration.
Krkn Dashboard is the visualization and control component of krkn-hub. It provides a user-friendly web interface to run chaos experiments, watch runs in real time, and—when configured—inspect historical runs and metrics via Elasticsearch and Grafana. Instead of using the CLI or editing config files, you can trigger and monitor Krkn scenarios from your browser.
What is Krkn Dashboard?
Krkn Dashboard is a web application that sits on top of krkn-hub. The dashboard offers:
A graphical UI for visualizing runs
Select scenarios, set parameters, and start runs from the browser, no command line required. Ideal for demos and anyone who prefers an interactive interface.
Real-time visibility
See running chaos containers and stream logs as scenarios execute. Spot failures and deficiencies as they happen to locate and fix issues faster.
Saved configurations
Store and reuse scenario parameters in your browser. Recreate a test or standardize runs across your team without re-entering the same values.
Analyzing past runs
Connect to Elasticsearch to query and display past run details. Use Grafana to link to dashboards for a specific run.
Central space for collaboration
One place to view runs, share configurations, and collaborate with your team. See status, logs, and history in a single UI instead of scattered terminals or configs.
Features
Run chaos scenarios from the UI
You can run the same chaos scenarios that krkn-hub supports, but by choosing a scenario and filling in the form in the dashboard:
Choose a scenario — e.g. pod-scenarios, container-scenarios, node-cpu-hog, node-io-hog, node-memory-hog, pvc-scenarios, node-scenarios, time-scenarios.
Set parameters — Namespace, label selectors, disruption count, timeouts, and other scenario-specific options (the UI fields map to the environment variables used by krkn-hub).
Provide cluster access — If running locally, either enter the path to your kubeconfig or upload a kubeconfig file. When running from a container, the dashboard uses a kubeconfig mounted at a fixed path.
Start the run — The dashboard starts the corresponding krkn-hub container (via Podman/Docker). You can then:
See the container in the list of running chaos runs.
Stream logs in real time in the UI.
Download logs or inspect run status until the container exits.
Save and load configurations
You can save the current scenario and parameters and load them later. This avoids re-entering the same values and helps you recreate a specific test or share settings. Storage is in the browser (local storage/cookies).
View past runs
If you use Elasticsearch to store Krkn run data, you can connect the dashboard to your Elasticsearch instance. After connecting, you can:
Query run details by date range and filters.
See historical chaos runs and their metadata in the dashboard.
This is optional. The dashboard works without Elasticsearch for running and monitoring live scenarios.
Link to Grafana dashboards
When Elasticsearch is connected and you have configured Grafana, the dashboard can generate links to Grafana dashboards for a given run (e.g. by run UUID and other variables). That lets you jump from a run in the dashboard to the corresponding metrics and visualizations in Grafana. Grafana configuration is optional.
Getting Started
Follow the installation steps (local or containerized) to run the dashboard.
6.1 - Using the UI
How to run scenarios and use the dashboard once it is running.
Using the UI
Once the dashboard is running, open http://localhost:3000 (or the port shown in the terminal) in your browser. The dashboard has a side menu with other dashboard views (Overview and Metrics). Each is described below.
Overview
The Overview page is the default landing page. It has two tabs at the top:
Kraken tab
Scenarios card — A set of scenario tiles (e.g. Pod Scenarios, Node CPU hog, Node IO hog, Node Memory hog). Click a scenario to select it for the next run.
Supported Parameters — Set your parameters for the selected scenario and either enter a kubeconfig path or upload a kubeconfig file. Use Start Kraken to launch the krkn-hub container for that scenario.
Pod Details — A table of all krkn-hub containers known to the dashboard. Use this to see which chaos runs are active or finished.
Logs tab
Logs viewer — A dropdown to select a running or past container (from the same list as Pod Details). Once selected, the panel shows that container’s live or captured logs so you can watch chaos output without using the terminal.
Metrics
The Metrics page is used for Elasticsearch and Grafana integration:
Storage Metrics (when not connected): Shows a form to connect to Elasticsearch (host, index, optional username/password, optional Grafana base URL and datasource). After submitting, the dashboard queries ES for past run details.
Storage table (when connected): The page generates graphics to better analyze run history. After a successful connection, a table of past runs from Elasticsearch appears. Rows can be expanded to show more details and, when Grafana is configured, a link to the Grafana dashboard for that run.
7 - What is krkn-ai?
Krkn-AI lets you automatically run Chaos scenarios and discover the most effective experiments to evaluate your system’s resilience.
How does it work?
Krkn-AI leverages evolutionary algorithms to generate experiments based on Krkn scenarios. By using user-defined objectives such as SLOs and application health checks, it can identify the critical experiments that impact the cluster.
Generate a Krkn-AI config file using discover. Running this command will generate a YAML file that is pre-populated with cluster component information and basic setup.
The config file can be further customized to suit your requirements for Krkn-AI testing.
Start Krkn-AI testing:
The evolutionary algorithm will use the cluster components specified in the config file as possible inputs required to run the Chaos scenarios.
User-defined SLOs and application health check feedback are taken into account to guide the algorithm.
Analyze results, evaluate the impact of different Chaos scenarios on application liveness and their fitness scores.
Krkn-AI uses Thanos Querier to fetch SLO metrics by PromQL. You can easily install it by setting up prometheus-operator in your cluster.
Deploy Sample Microservice
For demonstration purpose, we will deploy a sample microservice called robot-shop on the cluster:
# Change to Krkn-AI project directorycd krkn-ai/
# Namespace where to deploy the microservice applicationexportDEMO_NAMESPACE=robot-shop
# Whether the K8s cluster is an OpenShift clusterexportIS_OPENSHIFT=true./scripts/setup-demo-microservice.sh
# Set context to the demo namespaceoc config set-context --current --namespace=$DEMO_NAMESPACE# If you are using kubectl:# kubectl config set-context --current --namespace=$DEMO_NAMESPACE# Check whether pods are runningoc get pods
We will deploy a NGINX reverse proxy and a LoadBalancer service in the cluster to expose the routes for some of the pods.
# Setup NGINX reverse proxy for external access./scripts/setup-nginx.sh
# Check nginx podoc get pods -l app=nginx-proxy
# Test application endpoints./scripts/test-nginx-routes.sh
exportHOST="http://$(kubectl get service rs -o json | jq -r '.status.loadBalancer.ingress[0].hostname')"
Note
If your cluster uses Ingress or custom annotation to expose the services, make sure to follow those steps.
📝 Generate Configuration
Krkn-AI uses YAML configuration files to define experiments. You can generate a sample config file dynamically by running Krkn-AI discover command.
# Discover components in cluster to generate the config$ uv run krkn_ai discover -k ./tmp/kubeconfig.yaml \
-n "robot-shop"\
-pl "service"\
-nl "kubernetes.io/hostname"\
-o ./tmp/krkn-ai.yaml \
--skip-pod-name "nginx-proxy.*"
Discover command generates a yaml file as an output that contains the initial boilerplate for testing. You can modify this file to include custom SLO definitions, cluster components and configure algorithm settings as per your testing use-case.
Running Krkn-AI
Once your test configuration is set, you can start Krkn-AI testing using the run command. This command initializes a random population sample containing Chaos Experiments based on the Krkn-AI configuration, then starts the evolutionary algorithm to run the experiments, gather feedback, and continue evolving existing scenarios until the total number of generations defined in the config is met.
# Configure Prometheus# (Optional) In OpenShift cluster, the framework will automatically look for thanos querier in openshift-monitoring namespace. exportPROMETHEUS_URL='https://Thanos-Querier-url'exportPROMETHEUS_TOKEN='enter-access-token'# Start Krkn-AI testuv run krkn_ai run -vv -c ./krkn-ai.yaml -o ./tmp/results/ -p HOST=$HOST
Understanding the Results
In the ./tmp/results directory, you will find the results from testing. The final results contain information about each scenario, their fitness evaluation scores, reports, and graphs, which you can use to further investigate.
health_check_report.csv: Summary of application health checks containing details about the scenario, component, failure status and latency.
best_scenarios.yaml: YAML file containing information about best scenario identified in each generation.
best_generation.png: Visualization of best fitness score found in each generation.
scenario_<ids>.png: Visualization of response time line plot for health checks and heatmap for success and failures.
YAML:
scenario_<id>.yaml: YAML file detailing about the Chaos scenario executed which includes the krknctl command, fitness scores, health check metrices, etc. These files are organised under each generation folder.
Log:
scenario_<id>.log: Logs captured from krknctl scenario.
7.2 - Cluster Discovery
Automatically discover cluster components for Krkn-AI testing.
Krkn-AI uses a genetic algorithm to generate Chaos scenarios. These scenarios require information about the components available in the cluster, which is obtained from the cluster_components YAML field of the Krkn-AI configuration.
CLI Usage
$ uv run krkn_ai discover --help
Usage: krkn_ai discover [OPTIONS]

  Discover components for Krkn-AI tests

Options:
  -k, --kubeconfig TEXT   Path to cluster kubeconfig file.
  -o, --output TEXT       Path to save config file.
  -n, --namespace TEXT    Namespace(s) to discover components in. Supports
                          Regex and comma separated values.
  -pl, --pod-label TEXT   Pod Label Keys(s) to filter. Supports Regex and
                          comma separated values.
  -nl, --node-label TEXT  Node Label Keys(s) to filter. Supports Regex and
                          comma separated values.
  -v, --verbose           Increase verbosity of output.
  --skip-pod-name TEXT    Pod name to skip. Supports comma separated values
                          with regex.
  --help                  Show this message and exit.
Example
The example below filters cluster components from namespaces that match the patterns robot-.* and etcd. In addition to namespaces, we also provide filters for pod labels and node labels. This allows us to narrow down the necessary components to consider when running a Krkn-AI test.
The above command generates a config file that contains the basic setup to help you get started. You can customize the parameters as described in the configs documentation. If you want to exclude any cluster components—such as a pod, node, or namespace—from being considered for Krkn-AI testing, simply remove them from the cluster_components YAML field.
# Path to your kubeconfig filekubeconfig_file_path:"./path/to/kubeconfig.yaml"# Genetic algorithm parametersgenerations:5population_size:10composition_rate:0.3population_injection_rate:0.1scenario_mutation_rate:0.6# Duration to wait before running next scenario (seconds)wait_duration:30# Specify how result filenames are formattedoutput:result_name_fmt:"scenario_%s.yaml"graph_name_fmt:"scenario_%s.png"log_name_fmt:"scenario_%s.log"# Fitness function configuration for defining SLO# In the below example, we use Total Restarts in "robot-shop" namespace as the SLOfitness_function:query:'sum(kube_pod_container_status_restarts_total{namespace="robot-shop"})'type:pointinclude_krkn_failure:true# Chaos scenarios to consider during testingscenario:pod-scenarios:enable:trueapplication-outages:enable:truecontainer-scenarios:enable:falsenode-cpu-hog:enable:falsenode-memory-hog:enable:false# Cluster components to consider for Krkn-AI testingcluster_components:namespaces:- name:robot-shoppods:- containers:- name:cartlabels:service:cartenv:devname:cart-7cd6c77dbf-j4gsv- containers:- name:cataloguelabels:service:catalogueenv:devname:catalogue-94df6b9b-pjgsrservices:- labels:app.kubernetes.io/managed-by:Helmname:cartports:- port:8080protocol:TCPtarget_port:8080- labels:app.kubernetes.io/managed-by:Helmservice:cataloguename:catalogueports:- port:8080protocol:TCPtarget_port:8080- name:etcdpods:- containers:- name:etcdlabels:service:etcdname:etcd-0- containers:- name:etcdlabels:service:etcdname:etcd-1nodes:- labels:kubernetes.io/hostname:node-1disktype:SSDname:node-1taints:[]- labels:kubernetes.io/hostname:node-2disktype:HDDname:node-2taints:[]
7.3 - Run Krkn-AI
Execute automated resilience and chaos testing using the Krkn-AI run command.
The run command executes automated resilience and chaos testing using Krkn-AI. It initializes a random population samples containing Chaos Experiments based on your Krkn-AI configuration file, then starts the evolutionary algorithm to run the experiments, gather feedback, and continue evolving existing scenarios until stopping criteria is met.
CLI Usage
$ uv run krkn_ai run --help
Usage: krkn_ai run [OPTIONS]

  Run Krkn-AI tests

Options:
  -c, --config TEXT                     Path to Krkn-AI config file.
  -o, --output TEXT                     Directory to save results.
  -f, --format [json|yaml]              Format of the output file.  [default: yaml]
  -r, --runner-type [krknctl|krknhub]   Type of chaos engine to use.
  -p, --param TEXT                      Additional parameters for config file in key=value format.
  -v, --verbose                         Increase verbosity of output.  [default: 0]
  --help                                Show this message and exit.
Example
The following command runs Krkn-AI with verbose output (-vv), specifies the configuration file (-c), sets the output directory for results (-o), and passes an additional parameter (-p) to override the HOST variable in the config file:
$ uv run krkn_ai run -vv -c ./krkn-ai.yaml -o ./tmp/results/ -p HOST=$HOST
By default, Krkn-AI uses krknctl as engine. You can switch to krknhub by using the following flag:
$ uv run krkn_ai run -r krknhub -c ./krkn-ai.yaml -o ./tmp/results/
7.4 - Run Krkn-AI (Container)
Use Krkn-AI with a container image.
Krkn-AI can be run inside containers, which simplifies integration with continuous testing workflows.
Container Image
A pre-built container image is available on Quay.io:
podman pull quay.io/krkn-chaos/krkn-ai:latest
Running the Container
The container supports two modes controlled by the MODE environment variable:
1. Discovery Mode
Discovers cluster components and generates a configuration file.
When running Krkn-AI as a Podman container inside another container with FUSE, you can mount a volume to the container’s shared storage location to enable downloading and caching of KrknHub images.
Krkn-AI is configured using a simple declarative YAML file. This file can be automatically generated using Krkn-AI’s discover feature, which creates a config file from a boilerplate template. The generated config file will have the cluster components pre-populated based on your cluster.
7.5.1 - Evolutionary Algorithm
Configuring Evolutionary Algorithm
Krkn-AI uses an online learning approach by leveraging an evolutionary algorithm, where an agent runs tests on the actual cluster and gathers feedback by measuring various KPIs for your cluster and application. The algorithm begins by creating random population samples that contain Chaos scenarios. These scenarios are executed on the cluster, feedback is collected, and then the best samples (parents) are selected to undergo crossover and mutation operations to generate the next set of samples (offspring). The algorithm relies on heuristics to guide the exploration and exploitation of scenarios.
Terminologies
Generation: A single iteration or cycle of the algorithm during which the population evolves. Each generation produces a new set of candidate solutions.
Population: The complete set of candidate solutions (individuals) at a given generation.
Sample (or Individual): A single candidate solution within the population, often represented as a chromosome or genome. In our case, this is equivalent to a Chaos experiment.
Selection: The process of choosing individuals from the population (based on fitness) to serve as parents for producing the next generation.
Crossover: The operation of combining two Chaos experiments to produce a new scenario, encouraging the exploration of new solutions.
Mutation: A random alteration of parts of a Chaos experiment.
Scenario Mutation: The scenario itself is changed to a different one, introducing greater diversity in scenario execution while retaining the existing run properties.
Composition: The process of combining existing Chaos experiments into a grouped scenario to represent a single new scenario.
Population Injection: The introduction of new individuals into the population to escape stagnation.
Configurations
The algorithm relies on specific configurations to guide its execution. These settings can be adjusted in the Krkn-AI config file, which you generate using the discover command.
generations
Total number of generation loop to run (Default: 20)
The value for this field should be at least 1.
Setting this to a higher value increases Krkn-AI testing coverage.
Each scenario tested in the current generation retains some properties from the previous generation.
population_size
Minimum Population size in each generation (Default: 10)
The value for this field should be at least 2.
Setting this to a higher value will increase the number of scenarios tested per generation, which is helpful for running diverse test samples.
A higher value is also preferred when you have a large set of objects in cluster components and multiple scenarios enabled.
If you have a limited set of components to be evaluated, you can set a smaller population size and fewer generations.
crossover_rate
How often crossover should occur for each scenario parameter (Default: 0.6 and Range: [0.0, 1.0])
A higher crossover rate increases the likelihood that a crossover operation will create two new candidate solutions from two existing candidates.
Setting the crossover rate to 1.0 ensures that crossover always occurs during selection process.
mutation_rate
How often mutation should occur for each scenario parameter (Default: 0.7 and Range: [0.0, 1.0])
This helps to control the diversification among the candidates. A higher value increases the likelihood that a mutation operation will be applied.
Setting this to 1.0 ensures persistent mutation during the selection process.
scenario_mutation_rate
How often a mutation should result in a change to the scenario (Default: 0.6; Range: [0.0, 1.0])
A higher rate increases diversity between scenarios in each generation.
A lower rate gives priority to retaining the existing scenario across generations.
composition_rate
How often a crossover would lead to composition (Default: 0.0 and Range: [0.0, 1.0])
By default, this value is disabled, but you can set it to a higher rate to increase the likelihood of composition.
population_injection_rate
How often a random samples gets newly added to population (Default: 0.0 and Range: [0.0, 1.0])
A higher injection rate increases the likelihood of introducing new candidates into the existing generation.
population_injection_size
What’s the size of random samples that gets added to new population (Default: 2)
A higher injection size means that more diversified samples get added during the evolutionary algorithm loop.
This is beneficial if you want to start with a smaller population test set and then increase the population size as you progress through the test.
wait_duration
Time to wait after scenario execution. Sets Krkn’s --wait-duration parameter. (Default: 120 seconds)
stopping_criteria
Configuration for advanced stopping conditions based on fitness, saturation, or exploration limits. See Stopping Criteria for full details.
7.5.2 - Fitness Function
Configuring Fitness Function
The fitness function is a crucial element in the Krkn-AI algorithm. It evaluates each Chaos experiment and generates a score. These scores are then used during the selection phase of the algorithm to identify the best candidate solutions in each generation.
The fitness function can be defined as an SLO or as cluster metrics using a Prometheus query.
Fitness scores are calculated for the time range during which the Chaos scenario is executed.
Example
Let’s look at a simple fitness function that calculates the total number of restarts in a namespace:
This fitness function calculates the number of restarts that occurred during the test in the specified namespace. The resulting value is referred to as the Fitness Function Score. These scores are computed for each scenario in every generation and can be found in the scenario YAML configuration within the results. Below is an example of a scenario YAML configuration:
In the above result, the fitness score of 2 indicates that two restarts were observed in the namespace while running the node-memory-hog scenario. The algorithm uses this score as feedback to prioritize this scenario for further testing.
Types of Fitness Function
There are two types of fitness functions available in Krkn-AI: point and range.
Point-Based Fitness Function
In the point-based fitness function type, we calculate the difference in the fitness function value between the end and the beginning of the Chaos experiment. This difference signifies the change that occurred during the experiment phase, allowing us to capture the delta. This approach is especially useful for Prometheus metrics that are counters and only increase, as the difference helps us determine the actual change during the experiment.
E.g SLO: Pod Restarts across “robot-shop” namespace.
Certain SLOs require us to consider changes that occur over a period of time by using aggregate values such as min, max, or average. For these types of value-based metrics in Prometheus, the range type of Fitness Function is useful.
Because the range type is calculated over a time interval—and the exact timing of each Chaos experiment may not be known in advance—we provide a $range$ parameter that must be used in the fitness function definition.
Krkn-AI allows you to define multiple fitness function items in the YAML configuration, enabling you to track how individual fitness values vary for different scenarios in the final outcome.
You can assign a weight to each fitness function to specify how its value impacts the final score used during Genetic Algorithm selection. Each weight should be between 0 and 1. By default, if no weight is specified, it will be considered as 1.
Krkn-AI uses krknctl under the hood to trigger Chaos testing experiments on the cluster. As part of the CLI, it captures various feedback and returns a non-zero status code (exit status 2) when a failure occurs. By default, feedback from these failures is included in the Krkn-AI Fitness Score calculation.
You can disable this by setting the include_krkn_failure to false.
Note: If a Krkn scenario exits with a non-zero status code other than 2, Krkn-AI assigns a fitness score of -1 and stops the calculation of health scores. This typically indicates a misconfiguration or another issue with the scenario. For more details, please refer to the Krkn logs for the scenario.
Health Check
Results from application health checks are also incorporated into the fitness score. You can learn more about health checks and how to configure them in more detail here.
How to Define a Good Fitness Function
Scoring: The higher the fitness score, the more priority will be given to that scenario for generating new sets of scenarios. This also means that scenarios with higher fitness scores are more likely to have an impact on the cluster and should be further investigated.
Normalization: Krkn-AI currently does not apply any normalization, except when a fitness function is assigned with weights. While this does not significantly impact the algorithm, from a user interpretation standpoint, it is beneficial to use normalized SLO queries in PromQL. For example, instead of using the maximum CPU for a pod as a fitness function, it may be more convenient to use the CPU percentage of a pod.
Use-Case Driven: The fitness function query should be defined based on your use case. If you want to optimize your cluster for maximum uptime, a good fitness function could be to capture restart counts or the number of unavailable pods. Similarly, if you are interested in optimizing your cluster to ensure no downtime due to resource constraints, a good fitness function would be to measure the maximum CPU or memory percentage.
7.5.3 - Stopping Criteria
Configuring Stopping Criteria for the Genetic Algorithm
The stopping criteria framework lets users define when the genetic algorithm should terminate, allowing for more flexible control beyond strictly generation count or time limits. By configuring these parameters, you can ensure the algorithm stops once it achieves a target fitness or if it reaches a state of saturation where no further improvements or discoveries are being made.
Configurations
You can configure the following options under the stopping_criteria section of the Krkn-AI config file. All fields are optional and, with the exception of saturation_threshold, default to disabled (null).
fitness_threshold
Description: Stops the algorithm when the best fitness score reaches or exceeds this specific value.
Default: Disabled (null)
This is useful when you have a specific target fitness score (e.g., an SLO violation count) that, once reached, indicates the objective has been met.
generation_saturation
Description: Stops the algorithm if there is no significant improvement in the best fitness score for N consecutive generations.
Default: Disabled (null)
This helps prevent the algorithm from running needlessly after it has converged to a solution.
exploration_saturation
Description: Stops the algorithm if no new unique scenarios (test cases) are discovered for N consecutive generations.
Default: Disabled (null)
This indicates that the algorithm has likely exhausted its search space given the current configuration and is engaging in redundant exploration.
saturation_threshold
Description: Configures the minimum fitness improvement required to consider a fitness change as “significant” for the purpose of resetting the saturation counter.
Default:0.0001
If the improvement in fitness is less than this threshold, it is treated as stagnation.
Example Configuration
stopping_criteria:fitness_threshold:200# stop when fitness >= 200generation_saturation:5# stop if no improvement for 5 generationsexploration_saturation:3# stop if no new scenarios for 3 generationssaturation_threshold:0.0001# minimum improvement to reset saturation counter
7.5.4 - Application Health Checks
Configuring Application Health Checks
When defining the Chaos Config, you can provide details about your application endpoints. Krkn-AI can access these endpoints during the Chaos experiment to evaluate how the application’s uptime is impacted.
Note
Application endpoints must be accessible from the system where Krkn-AI is running in order to reach the service.
Configuration
The following configuration options are available when defining an application for health checks:
name: Name of the service.
url: Service endpoint; supports parameterization with “$”.
status_code: Expected status code returned when accessing the service.
timeout: Timeout period after which the request is canceled.
interval: How often to check the endpoint.
stop_watcher_on_failure: This setting allows you to stop the health check watcher for an endpoint after it encounters a failure.
When defining Krkn-AI config files, the URL entry for an application may vary depending on the cluster. To make the URL configuration more manageable, you can specify the values for these parameters at runtime using the --param flag.
In the previous example, the $HOST variable in the config can be dynamically replaced during the Krkn-AI experiment run, as shown below.
uv run krkn_ai run -c krkn-ai.yaml -o results/ -p HOST=http://example.cluster.url/nginx
Configure Health Check Score into Fitness Function
By default, the results of health checks—including whether each check succeeded and the response times—are incorporated into the overall Fitness Function score. This allows Krkn-AI to use application health as part of its evaluation criteria.
If you want to exclude health check results from influencing the fitness score, you can set the include_health_check_failure and include_health_check_response_time fields to false in your configuration.
By default, scenarios are not enabled. Depending on your use case, you can enable or disable these scenarios in the krkn-ai.yaml config file by setting the enable field to true or false.
Krkn-AI generates various output files during the execution of chaos experiments, including scenario YAML files, graph visualizations, and log files. By default, these files follow a standard naming convention, but you can customize the file names using format strings in the configuration file.
Available Parameters
The output section in your krkn-ai.yaml configuration file allows you to customize the naming format for different output file types:
result_name_fmt
Specifies the naming format for scenario result YAML files. These files contain the complete scenario configuration and execution results for each generated scenario.
Default:"scenario_%s.yaml"
graph_name_fmt
Specifies the naming format for graph visualization files. These files contain visual representations of the health check latency and success information.
Default:"scenario_%s.png"
log_name_fmt
Specifies the naming format for log files. These files contain execution logs for each scenario run.
Default:"scenario_%s.log"
Format String Placeholders
The format strings support the following placeholders:
%g - Generation number
%s - Scenario ID
%c - Scenario Name (e.g pod_scenarios)
Example
Here’s an example configuration that customizes all output file names:
With this configuration, files will be named like:
gen_0_scenario_1_pod_scenarios.yaml
gen_0_scenario_1_pod_scenarios.png
gen_0_scenario_1_pod_scenarios.log
7.5.7 - Elastic Search
Configuring Elasticsearch for Krkn-AI results storage
Krkn-AI supports integration with Elasticsearch to store scenario configurations, run results, and metrics. This allows you to centralize and query experiment data using Elasticsearch’s search and visualization capabilities (e.g., with Kibana).
Configuration Parameters
enable (bool): Set to true to enable saving results to Elasticsearch. Default: false.
server (string): URL or address of your Elasticsearch server (e.g., http://localhost).
port (int): Port to connect to Elasticsearch (default: 9200).
username (string): Username for Elasticsearch authentication (can reference environment variables).
password (string): Password for Elasticsearch authentication. If using environment substitution, prefix with __ to treat as private.
verify_certs (bool): Set to true to verify SSL certificates. Default: true.
index (string): Name prefix for the Elasticsearch index where Krkn-AI results will be stored (e.g., krkn-ai).
Example Configuration
elastic:enable:true# Enable Elasticsearch integrationserver:"http://localhost"# Elasticsearch server URLport:9200# Elasticsearch portusername:"$ES_USER"# Username (environment substitution supported)password:"$__ES_PASSWORD"# Password (start with __ for sensitive/private handling)verify_certs:true# Verify SSL certificatesindex:"krkn-ai"# Index prefix for storing results
In addition to the standard Krkn telemetry and metrics indices, Krkn-AI creates two dedicated Elasticsearch indices to store detailed run information:
krkn-ai-config: Stores comprehensive information about the Krkn-AI configuration for each run, including parameters for the genetic algorithm, enabled scenarios, SLO definitions, and other configuration details.
krkn-ai-results: Stores the results of each Krkn-AI run, such as fitness scores, health check evaluations, and related metrics.
Note: Depending on the complexity and number of scenarios executed, Krkn-AI can generate a significant amount of metrics and data per run. Ensure that your Elasticsearch deployment is sized appropriately to handle this volume.
8 - Getting Started with Running Scenarios
Getting started with Krkn-chaos
Quick Start with krknctl (Recommended)
Recommended Approach
krknctl is the recommended and easiest way to run krkn scenarios. It provides command auto-completion, input validation, and abstracts the complexities of the container environment so you can focus on chaos engineering.
Why krknctl?
krknctl is a dedicated CLI tool that streamlines running chaos scenarios by providing:
Command auto-completion - Quick access to all available commands
Input validation - Catch errors before they happen
Scenario descriptions - Built-in documentation and instructions
Simple workflow - No need to manage config files or containers
To run multiple scenarios, you’ll edit the krkn config file and add multiple scenarios into chaos_scenarios. If you want to run multiple scenario files that are the same scenario type you can add multiple items under the scenario_type. If you want to run multiple different scenario types you can add those under chaos_scenarios
You can either copy an existing scenario yaml file and make it your own, or fill in one of the templates below to suit your needs.
Common Scenario Edits
If you just want to make small changes to pre-existing scenarios, feel free to edit the scenario file itself.
Example of Quick Pod Scenario Edit:
If you want to kill 2 pods instead of 1 in any of the pre-existing scenarios, you can either edit the iterations number located at config or edit the kill count in the scenario file
For example, for adding a pod level scenario for a new application, refer to the sample scenario below to know what fields are necessary and what to add in each location:
# yaml-language-server: $schema=../plugin.schema.json- id: kill-pods
config:
namespace_pattern: ^<namespace>$
label_selector: <pod label>
kill: <number of pods to kill>
krkn_pod_recovery_time: <expected timefor the pod to become ready>
Node Scenario Yaml Template
node_scenarios:
- actions: # Node chaos scenarios to be injected. - <chaos scenario>
- <chaos scenario>
node_name: <node name> # Can be left blank. label_selector: <node label>
instance_kill_count: <number of nodes on which to perform action>
timeout: <duration to waitfor completion>
cloud_type: <cloud provider>
Time Chaos Scenario Template
time_scenarios:
  - action: 'skew_time' or 'skew_date'
    object_type: 'pod' or 'node'
    label_selector: <label of pod or node>
RBAC
Based on the type of chaos test being executed, certain scenarios may require elevated privileges. The specific RBAC Authorization needed for each Krkn scenario are outlined in detail at the following link: Krkn RBAC
9 - Installation
Details on how to install krkn, krkn-hub, and krknctl
Choose Your Installation Method
Krkn provides multiple ways to run chaos scenarios. Choose the method that best fits your needs:
krknctl is the recommended way to run Krkn. It provides the simplest path to chaos testing with powerful capabilities including complex workflow orchestration, built-in scenario discovery, and interactive query support — all without managing configuration files.
Recommendation
Look for features marked with [BETA] (e.g., [BETA] Krkn Resilience Score). Beta features provide early access to new capabilities for experimentation and feedback and may not yet meet the stability, performance, or compatibility guarantees of GA features. Please refer to the Beta feature policy for more details.
Installation Methods
krknctl (Recommended)
What is it? A dedicated command-line interface (CLI) tool that simplifies running Krkn chaos scenarios while providing powerful orchestration capabilities.
Why use it?
Complex workflow orchestration — chain and orchestrate multiple chaos scenarios in sophisticated workflows
Query capabilities — discover, understand, and explore all supported scenarios directly from the CLI
Ease of use — command auto-completion, built-in input validation, and interactive prompts remove the guesswork
No configuration files — no need to manage YAML configs or Python environments manually
Container-native — runs scenarios via container runtime (Podman/Docker) with zero setup overhead
Best for: All users — from first-time chaos engineers to teams building complex resilience testing workflows.
It is recommended to run Krkn external to the cluster (Standalone or Containerized) hitting the Kubernetes/OpenShift API. Running it inside the cluster might be disruptive to itself and may not report results if the chaos leads to API server instability.
Power Architecture (ppc64le)
To run Krkn on Power (ppc64le) architecture, build and run a containerized version by following the instructions here.
9.1 - Krkn
Krkn aka Kraken
Installation
Clone the Repository
To clone and use the latest krkn version follow the directions below. If you’re wanting to contribute back to krkn in anyway in the future we recommend forking the repository first before cloning.
To be sure that krkn’s dependencies don’t interfere with other python dependencies you may have locally, we recommend creating a virtual environment before installing the dependencies. We have only tested up to python 3.11
Make sure python3-devel and latest pip versions are installed on the system. The dependencies install has been tested with pip >= 21.1.3 versions.
Where can your user find your project code? How can they install it (binaries, installable package, build from source)? Are there multiple options/versions they can install and how should they choose the right one for them?
Getting Started with Krkn
If you are wanting to try to edit your configuration files and scenarios see getting started doc
Krkn-hub is a wrapper that allows running Krkn chaos scenarios via podman or docker runtime with scenario parameters/configuration defined as environment variables.
krknctl is a CLI that allows running Krkn chaos scenarios via podman or docker runtime with scenarios parameters/configuration passed as command line options or a json graph for complex workflows.
What’s next?
Please refer to the getting started guide, pick the scenarios of interest and follow the instructions to run them via Krkn, Krkn-hub or Krknctl. Running via Krkn-hub or Krknctl are recommended for ease of use and better user experience.
9.2 - krkn-hub
Krkn-hub aka kraken-hub
Hosts container images and wrapper for running scenarios supported by Krkn, a chaos testing tool for Kubernetes clusters to ensure it is resilient to failures. All we need to do is run the containers with the respective environment variables defined as supported by the scenarios without having to maintain and tweak files!
Set Up
You can use docker or podman to run kraken-hub
Install Podman your certain operating system based on these instructions
Docker is also supported but all variables you want to set (separate from the defaults) need to be set at the command line In the form -e <VARIABLE>=<value>
You can take advantage of the get_docker_params.sh script to create your parameters string This will take all environment variables and put them in the form “-e =” to make a long string that can get passed to the command
For example: docker run $(./get_docker_params.sh) --net=host -v <path-to-kube-config>:/home/krkn/.kube/config:Z -d quay.io/redhat-chaos/krkn-hub:power-outages
Tip
Because the container runs with a non-root user, ensure the kube config is globally readable before mounting it in the container. You can achieve this with the following commands: kubectl config view –flatten > ~/kubeconfig && chmod 444 ~/kubeconfig && docker run $(./get_docker_params.sh) –name=<container_name> –net=host -v ~kubeconfig:/home/krkn/.kube/config:Z -d containers.krkn-chaos.dev/krkn-chaos/krkn-hub:<scenario>
What’s next?
Please refer to the getting started guide, pick the scenarios of interest and follow the instructions to run them via Krkn, Krkn-hub or Krknctl. Running via Krkn-hub or Krknctl are recommended for ease of use and better user experience.
9.3 - krknctl
how to install, build and configure the CLI
Install krknctl (Recommended)
Use the official install script as the primary installation method:
The krknctl binary is available for download from GitHub releases for supported operating systems and architectures. Extract the tarball and add the binary to your $PATH.
Build from source
Fork and clone the repository
Fork the repository:
$ git clone https://github.com/<github_user_id>/krknctl.git
$ cd krknctl
Set your cloned local to track the upstream repository:
To generate the random words we use the american dictionary, it is often available but if that’s not the case:
Fedora/RHEL: sudo dnf install words
Ubuntu/Debian: sudo apt-get install wamerican
Build dependencies
Linux
To build the only system package required is libbtrfs:
Fedora/RHEL: sudo dnf install btrfs-progs-devel
Ubuntu/Debian: sudo apt-get install libbtrfs-dev
MacOS
gpgme: brew install gpgme
Build command
go build -tags containers_image_openpgp -ldflags="-w -s" -o bin/ ./...
Note
To build for different operating systems/architectures refer to GOOSGOARCHgolang variables
Configure Autocompletion:
The first step to have the best experience with the tool is to install the autocompletion in the shell so that the tool
will be able to suggest to the user the available command and the description simply hitting tab twice.
Bash (linux):
source <(krknctl completion bash)
Tip
To install autocompletion permanently add this command to .bashrc (setting the krknctl binary path correctly)
To install autocompletion permanently add this command to .zshrc (setting the krknctl binary path correctly)
Container Runtime:
The tool supports both Podman and Docker to run the krkn-hub scenario containers. The tool interacts with the container
runtime through Unix socket. If both container runtimes are installed in the system the tool will default on Podman.
Podman:
Steps required to enable the Podman support
Linux:
enable and activate the podman API daemon
sudo systemctl enable --now podman
activate the user socket
systemctl enable --user --now podman.socket
MacOS:
If both Podman and Docker are installed be sure that the docker compatibility is disabled
Docker:
Linux:
Check that the user has been added to the docker group and can correctly connect to the Docker unix socket running the command podman ps if an error is returned run the command sudo usermod -aG docker $USER
What’s next?
Please refer to the getting started guide, pick the scenarios of interest and follow the instructions to run them via Krkn, Krkn-hub or Krknctl. Running via Krkn-hub or Krknctl are recommended for ease of use and better user experience.
9.4 - Setting Up Disconnected Enviornment
Getting Your Disconnected Enviornment Set Up
Getting Started Running Chaos Scenarios in a Disconnected Enviornment
Mirror following images on the bastion host
quay.io/krkn-chaos/krkn-hub:node-scenarios-bm - Master/worker node disruptions on baremetal
Hog scenarios ( CPU, Memory and IO ) - quay.io/krkn-chaos/krkn-hog
SYN flood - quay.io/krkn-chaos/krkn-syn-flood:latest
Pod network filter scenarios - quay.io/krkn-chaos/krkn-network-chaos:latest
Service hijacking scenarios - quay.io/krkn-chaos/krkn-service-hijacking:v0.1.3
How to Mirror
The strategy is simple:
Pull & Save: On a machine with internet access, pull the desired image from quay.io and use podman save to package it into a single archive file (a .tar file).
Transfer: Move this archive file to your disconnected cluster node using a method like a USB drive, a secure network file transfer, or any other means available.
Load: On the disconnected machine, use podman load to import the image from the archive file into the local container storage. The cluster’s container runtime can then use it.
Step-by-Step Instructions
Here’s a practical example using the quay.io/krkn-chaos/krkn-hub image.
Step 1: On the Connected Machine (Pull and Save)
First, pull the image from quay.io and then save it to a tarball.
Step 3: On the Disconnected Machine (Load and Verify)
Once the file is on the disconnected machine, use podman load to import it.
Load the image: The -i or –input flag specifies the source archive.
podman load -i pod-scenarios.tar
Podman will read the tarball and restore the image layers into its local storage.
Verify the image is loaded: Check that the image now appears in your local image list.
podman images
You should see quay.io/krkn-chaos/krkn-hub in the output, ready to be used by your applications. 👍
REPOSITORY                       TAG      IMAGE ID      CREATED        SIZE
- quay.io/krkn-chaos/krkn-hub    pod-scenarios  b1a13a82513f  3 weeks ago    220 MB
The image is now available locally on that node for your container runtime (like CRI-O in OpenShift/Kubernetes) to create containers without needing to reach the internet. You may need to repeat this loading process on every node in the cluster that might run the container, or push it to a private registry within your disconnected environment.
To clone and use the latest krkn version follow the directions below. If you’re wanting to contribute back to Krkn-AI in anyway in the future we recommend forking the repository first before cloning.
$ git clone https://github.com/krkn-chaos/krkn-ai.git
$ cd krkn-ai
Fork and Clone the Repository
Fork the repository
$ git clone https://github.com/<github_user_id>/krkn-ai.git
$ cd krkn-ai
Set your cloned local to track the upstream repository:
cd krkn-ai
git remote add upstream https://github.com/krkn-chaos/krkn-ai
To be sure that Krkn-AI’s dependencies don’t interfere with other python dependencies you may have locally, we recommend creating a virtual environment before installing the dependencies. We have only tested up to python 3.11
$ pip install uv
$ uv venv --python 3.11
$ source .venv/bin/activate
$ uv pip install -e .
# Check if installation is successful$ uv run krkn_ai --help
Note
Make sure python3-devel and latest pip versions are installed on the system. The dependencies install has been tested with pip >= 21.1.3 versions.
Getting Started with Krkn-AI
To configure Krkn-AI testing scenarios, check out getting started doc.
9.6 - Krkn Dashboard
How to install and run the Krkn Dashboard (local or containerized).
The Krkn Dashboard is a web UI for running and observing Krkn chaos scenarios. You can run it locally (Node.js on your machine) or containerized (Podman/Docker).
Prerequisites (both methods)
Kubernetes cluster — You need a cluster and a kubeconfig so that the dashboard can target it for chaos runs. If you don’t have one, see Kubernetes, minikube, K3s, or OpenShift.
Podman or Docker — The dashboard starts chaos runs by launching krkn-hub containers; the host must have Podman (or Docker) installed and available.
# Replace <RELEASE_TAG> with your desired version (e.g., v1.0.0)git clone --branch <RELEASE_TAG> --single-branch https://github.com/krkn-chaos/krkn-dashboard.git
cd krkn-dashboard
Method 2: Download release tarball
wget https://github.com/krkn-chaos/krkn-dashboard/archive/refs/tags/<RELEASE_TAG>.tar.gz
# Extract and cd into the directory
Method 3: Clone latest release
LATEST_TAG=$(curl -s https://api.github.com/repos/krkn-chaos/krkn-dashboard/releases/latest | grep '"tag_name":'| sed -E 's/.*"([^"]+)".*/\1/')git clone --branch $LATEST_TAG --single-branch https://github.com/krkn-chaos/krkn-dashboard.git
cd krkn-dashboard
echo"Cloned release: $LATEST_TAG"
Build the image
Replace <image-name> with the image name and tag you want (e.g. krkn-dashboard:latest).
cd krkn-dashboard
podman build -t <image-name> -f containers/Dockerfile .
(Use docker build instead of podman build if you use Docker.)
Run the container
Prepare a directory for assets (e.g. kubeconfig) in the git folder:
exportCHAOS_ASSETS=$(pwd)/src/assets
Copy your kubeconfig into $CHAOS_ASSETS as kubeconfig (so the dashboard inside the container can target your cluster).
Run the container (as root or with permissions for the Podman socket). Replace <container-name> with the name you want for the container, and <image-name> with the image you built in the previous step.
For Docker, use -v /var/run/docker.sock:/var/run/docker.sock instead of the Podman socket path, and ensure the container can reach the Docker daemon.
Open http://localhost:3000 in your browser to use the dashboard and trigger Krkn scenarios.
Tip
Ensure the kubeconfig inside CHAOS_ASSETS is readable by the user running the dashboard process in the container. For permission issues: kubectl config view –flatten > ~/kubeconfig && chmod 444 ~/kubeconfig, then copy or mount that file as $CHAOS_ASSETS/kubeconfig.
10 - Chaos Scenario Rollback
Robust File-based Rollback Mechanism to Restore Cluster State Automatically By Krkn
Krkn supports a human-readable, versioned file-based rollback mechanism inspired by Alembic, generating Python version files for changes made during chaos scenarios.
With this approach, Krkn ensures:
Rollback operations are reliably persisted to disk, even in the event of unexpected program failures.
Version files clearly document the changes made during chaos scenarios in a human-readable format.
Specific changes can be easily identified and restored during rollback.
A concise and transparent history of all modifications made throughout chaos testing.
Supported Rollback Scenarios
Krkn supports rollback for the following scenarios.
Krkn provides list-rollback and execute-rollback commands for managing rollback operations.
list-rollback
list-rollback: List rollback version files in a tree-like format
-r RUN_UUID, --run_uuid=RUN_UUID Flag: Optional. Specify the Run UUID to filter the list of rollback version files.
-s SCENARIO_TYPE, --scenario_type=SCENARIO_TYPE Flag: Optional. Specify the Scenario Type to filter the list of rollback version files.
Example Usage:
# Without filteringpython run_kraken.py list-rollback --config config/config.yaml
# With filtering by Run UUIDpython run_kraken.py list-rollback --config config/config.yaml -r <run_uuid>
# With filtering by Scenario Typepython run_kraken.py list-rollback --config config/config.yaml -s <scenario_type>
# With filtering by both Run UUID and Scenario Typepython run_kraken.py list-rollback --config config/config.yaml -r <run_uuid> -s <scenario_type>
execute-rollback: Execute rollback version files and cleanup if successful
By default, all version files located in the rollback_versions_directory (/tmp/kraken-rollback/) will be executed.
The version files will be renamed with .executed suffix for further inspection.
-r RUN_UUID, --run_uuid=RUN_UUID Flag: Optional. Specify the Run UUID to filter the execution of rollback version files.
-s SCENARIO_TYPE, --scenario_type=SCENARIO_TYPE Flag: Optional. Specify the Scenario Type to filter the execution of rollback version files.
Note: The Krkn program will leverage importlib to dynamically import the rollback callable function and information needed for execution, and execute them in the Krkn program context instead of using subprocesses or external executables.
Example Usage:
# Without filteringpython run_kraken.py execute-rollback --config config/config.yaml
# With filtering by Run UUIDpython run_kraken.py execute-rollback --config config/config.yaml -r <run_uuid>
# With additional filtering by Scenario Typepython run_kraken.py execute-rollback --config config/config.yaml -r <run_uuid> -s <scenario_type>
Example Output:
2025-08-22 15:54:06,137 [INFO] Executing rollback version files
2025-08-22 15:54:06,137 [WARNING] scenario_type is not specified, executing all scenarios in rollback directory
2025-08-22 15:54:06,137 [INFO] Executing rollback forrun_uuid=d3f0859b-91f7-490a-afb9-878478b1574a, scenario_type=*
2025-08-22 15:54:06,137 [INFO] Executing rollback version files forrun_uuid=d3f0859b-91f7-490a-afb9-878478b1574a, scenario_type=*
2025-08-22 15:54:06,137 [INFO] Executing rollback version file: /tmp/kraken-rollback/1755523355298089000-d3f0859b-91f7-490a-afb9-878478b1574a/application_outages_scenarios_1755523353558511000_mfsaltfl.py
2025-08-22 15:54:06,139 [INFO] Executing rollback callable...
2025-08-22 15:54:06,139 [INFO] Rolling back network policy: krkn-deny-xafee in namespace: test-application-outage
2025-08-22 15:54:06,148 [INFO] Network policy already deleted
2025-08-22 15:54:06,148 [INFO] Network policy rollback completed successfully.
2025-08-22 15:54:06,148 [INFO] Rollback completed.
2025-08-22 15:54:06,148 [INFO] Executed /tmp/kraken-rollback/1755523355298089000-d3f0859b-91f7-490a-afb9-878478b1574a/application_outages_scenarios_1755523353558511000_mfsaltfl.py successfully.
2025-08-22 15:54:06,149 [INFO] Rollback execution completed successfully, cleaning up version files
2025-08-22 15:54:06,149 [INFO] Cleaning up rollback version files forrun_uuid=d3f0859b-91f7-490a-afb9-878478b1574a, scenario_type=None
2025-08-22 15:54:06,149 [INFO] Removed /tmp/kraken-rollback/1755523355298089000-d3f0859b-91f7-490a-afb9-878478b1574a/application_outages_scenarios_1755523353558511000_mfsaltfl.py successfully.
2025-08-22 15:54:06,149 [INFO] Rollback execution and cleanup completed successfully
Configuration of Rollback
There are two configuration options for rollback scenarios in the kraken section of the configuration file: auto_rollback and rollback_versions_directory.
By default, these options are set as follows and can be overridden in config/config.yaml file.
kraken:auto_rollback:True# Enable auto rollback for scenarios.rollback_versions_directory:/tmp/kraken-rollback # Directory to store rollback version files.
Details of Rollback Scenario
Lifecycle of Rollback
The lifecycle of a rollback operation is scoped to each chaos scenario.
    flowchart TD
        Start[Krkn Program Start] --> Loop{For each Chaos Scenario}
        Loop  --> End[All Scenarios Complete]
        Loop -- Chaos Scenario --> RollbackSetup[Set rollback_callable and flush version file to disk before making any change]
        RollbackSetup --> ClusterChange[Make change to cluster]
        ClusterChange --> ErrorCheck{Unexpected error during the run?}
        ErrorCheck -- Yes --> ExecuteRollback[Execute the version file, then rename it by adding the .executed suffix.]
        ExecuteRollback --> RunComplete[Run Complete]
        ErrorCheck -- No --> Cleanup[Cleanup version file]
        Cleanup --> RunComplete
        RunComplete --> Loop
Set rollback callable: Krkn will flush the corresponding rollback_callable function including variable state into Python version file before making any change to the cluster. There might be multiple version files created for a single chaos scenario, since there can be multiple steps changing the cluster state.
Execute version file: If an unexpected error occurs, Krkn will execute the flushed version file to restore the cluster to its previous state, then rename it by adding the .executed suffix for further inspection.
Cleanup: If the rollback is successful, Krkn will cleanup all version files created during the chaos scenario. If not, the version files will remain on disk for further inspection and debugging.
Version Files Directory Structure
The version files directory structure will be organized by
Versions Directory: The root directory for all version files, defaulting to /tmp/kraken-rollback.
Rollback Context Directory: The Rollback Context Directory is formatted as <timestamp (ns)>-<run_uuid>. Since each Run of a chaos scenario generates a unique Run UUID, which is used to identify the context of the rollback operation.
Version Files: Each version file will be named as <chaos_scenario_name>_<timestamp (ns)>_<random_suffix>.py.
The version file is a Python executable and can be run directly using python path/to/version/file.py. However, it is recommended to use the execute-rollback command to perform the rollback operation within the main program context of Krkn. For more information, refer to the Rollback Command section.
Here is an example of the actual content of a version file, it contains
The rollback callable function to execute, which is rollback_hog_pod in this case
The RollbackContent variable to store the information needed for the rollback
# This file is auto-generated by krkn-lib.# It contains the rollback callable and its arguments for the scenario plugin.fromdataclassesimportdataclassimportosimportloggingfromtypingimportOptionalfromkrkn_lib.utilsimportSafeLoggerfromkrkn_lib.ocpimportKrknOpenshiftfromkrkn_lib.telemetry.ocpimportKrknTelemetryOpenshift@dataclass(frozen=True)classRollbackContent:resource_identifier:strnamespace:Optional[str]=None# Actual rollback callabledefrollback_hog_pod(rollback_content:RollbackContent,lib_telemetry:KrknTelemetryOpenshift):"""
Rollback function to delete hog pod.
:param rollback_content: Rollback content containing namespace and resource_identifier.
:param lib_telemetry: Instance of KrknTelemetryOpenshift for Kubernetes operations
"""try:namespace=rollback_content.namespacepod_name=rollback_content.resource_identifierlogging.info(f"Rolling back hog pod: {pod_name} in namespace: {namespace}")lib_telemetry.get_lib_kubernetes().delete_pod(pod_name,namespace)logging.info("Rollback of hog pod completed successfully.")exceptExceptionase:logging.error(f"Failed to rollback hog pod: {e}")# Create necessary variables for executionlib_openshift=Nonelib_telemetry=Nonerollback_content=RollbackContent(namespace="test-application-outage",resource_identifier="memory-hog-ngdjp")# Main entry point for executionif__name__=='__main__':# setup logginglogging.basicConfig(level=logging.INFO,format="%(asctime)s [%(levelname)s] %(message)s",handlers=[logging.StreamHandler(),])# setup logging and get kubeconfig pathkubeconfig_path=os.getenv("KUBECONFIG","~/.kube/config")log_directory=os.path.dirname(os.path.abspath(__file__))os.makedirs(os.path.join(log_directory,'logs'),exist_ok=True)# setup SafeLogger for telemetrytelemetry_log_path=os.path.join(log_directory,'logs','telemetry.log')safe_logger=SafeLogger(telemetry_log_path)# setup krkn-lib objectslib_openshift=KrknOpenshift(kubeconfig_path=kubeconfig_path)lib_telemetry=KrknTelemetryOpenshift(safe_logger=safe_logger,lib_openshift=lib_openshift)# executelogging.info('Executing rollback callable...')rollback_hog_pod(rollback_content,lib_telemetry)logging.info('Rollback completed.')
11 - Scenarios
Krkn scenario list
Tip
Many pod scenarios now support the exclude_label parameter to protect critical pods while testing others. See individual scenario pages (Pod Failures, Pod Network Chaos) for details.
Skews system time and date to test time-sensitive applications and certificate handling
Cloud Agnostic
11.1 - Krkn-Hub All Scenarios Variables
These variables are to be used for the top level configuration template that are shared by all the scenarios in Krkn-hub
See the description and default values below
Supported parameters for all scenarios in Krkn-Hub
The following environment variables can be set on the host running the container to tweak the scenario/faults being injected:
example:
export <parameter_name>=<value>
Parameter
Description
Default
CERBERUS_ENABLED
Set this to true if cerberus is running and monitoring the cluster
False
CERBERUS_URL
URL to poll for the go/no-go signal
http://0.0.0.0:8080
WAIT_DURATION
Duration in seconds to wait between each chaos scenario
60
ITERATIONS
Number of times to execute the scenarios
1
DAEMON_MODE
Iterations are set to infinity which means that the kraken will cause chaos forever
False
PUBLISH_KRAKEN_STATUS
If you want
True
SIGNAL_ADDRESS
Address to print kraken status to
0.0.0.0
PORT
Port to print kraken status to
8081
SIGNAL_STATE
Waits for the RUN signal when set to PAUSE before running the scenarios, refer docs for more details
RUN
DEPLOY_DASHBOARDS
Deploys mutable grafana loaded with dashboards visualizing performance metrics pulled from in-cluster prometheus. The dashboard will be exposed as a route.
False
CAPTURE_METRICS
Captures metrics as specified in the profile from in-cluster prometheus. Default metrics captures are listed here
False
ENABLE_ALERTS
Evaluates expressions from in-cluster prometheus and exits 0 or 1 based on the severity set. Default profile.
False
ALERTS_PATH
Path to the alerts file to use when ENABLE_ALERTS is set
config/alerts
ELASTIC_SERVER
Be able to track telemtry data in elasticsearch, this is the url of the elasticsearch data storage
blank
ELASTIC_INDEX
Elastic search index pattern to post results to
blank
HEALTH_CHECK_URL
URL to continually check and detect downtimes
blank
HEALTH_CHECK_INTERVAL
Interval at which to get
2
HEALTH_CHECK_BEARER_TOKEN
Bearer token used for authenticating into health check URL
blank
HEALTH_CHECK_AUTH
Tuple of (username,password) used for authenticating into health check URL
blank
HEALTH_CHECK_EXIT_ON_FAILURE
If value is True exits when health check failed for application, values can be True/False
blank
HEALTH_CHECK_VERIFY
Health check URL SSL validation; can be True/False
False
KUBE_VIRT_CHECK_INTERVAL
Interval at which to test kubevirt connections
2
KUBE_VIRT_NAMESPACE
Namespace to find VMIs in and watch
blank
KUBE_VIRT_NAME
Regex style name to match VMIs to watch
blank
KUBE_VIRT_FAILURES
If value is True exits will only report when ssh connections fail to vmi, values can be True/False
blank
KUBE_VIRT_DISCONNECTED
Use disconnected check by passing cluster API, can be True/False
False
KUBE_VIRT_NODE_NAME
If set, will filter vms further to only track ones that are on specified node name
blank
KUBE_VIRT_EXIT_ON_FAIL
Fails run if VMs still have false status at end of run, can be True/False
False
KUBE_VIRT_SSH_NODE
If set, will be a backup way to ssh to a node. Will want to set to a node that isn’t targeted in chaos
blank
CHECK_CRITICAL_ALERTS
When enabled will check prometheus for critical alerts firing post chaos
OC Cli path, if not specified will be search in $PATH
blank
Note
For setting the TELEMETRY_ARCHIVE_SIZE,the higher the number of archive files will be produced and uploaded (and processed by backup_thread simultaneously).For unstable/slow connection is better to keep this value low increasing the number of backup_threads, in this way, on upload failure, the retry will happen only on the failed chunk without affecting the whole upload.
11.2 - Krknctl All Scenarios Variables
These variables are to be used for the top level configuration template that are shared by all the scenarios in Krknctl
See the description and default values below
Supported parameters for all scenarios in KrknCtl
The following environment variables can be set on the host running the container to tweak the scenario/faults being injected:
Usage example:--<parameter> <value>
Parameter
Description
Type
Possible Values
Default
–cerberus-enabled
Enables Cerberus Support
enum
True/False
False
–cerberus-url
Cerberus http url
string
-
http://0.0.0.0:8080
–distribution
Selects the orchestrator distribution
enum
openshift/kubernetes
openshift
–krkn-kubeconfig
Sets the path where krkn will search for kubeconfig in container
string
-
/home/krkn/.kube/config
–wait-duration
Waits for a certain amount of time after the scenario
number
-
1
–iterations
Number of times the same chaos scenario will be executed
How often to check the health check urls (seconds)
number
-
2
–health-check-url
URL to check the health of
string
-
-
–health-check-auth
Authentication tuple to authenticate into health check URL
string
-
-
–health-check-bearer-token
Bearer token to authenticate into health check URL
string
-
-
–health-check-exit
Exit on failure when health check URL is not able to connect
string
-
-
–health-check-verify
SSL Verification to authenticate into health check URL
string
-
false
–kubevirt-check-interval
How often to check the KubeVirt VMs SSH status (seconds)
number
-
2
–kubevirt-namespace
KubeVirt namespace to check the health of
string
-
-
–kubevirt-name
KubeVirt regex names to watch
string
-
-
–kubevirt-only-failures
KubeVirt checks only report if failure occurs
enum
True/False
false
–kubevirt-disconnected
KubeVirt checks in disconnected mode, bypassing the cluster’s API
enum
True/False
false
–kubevirt-ssh-node
KubeVirt backup node to SSH into when checking VMI IP address status
string
-
false
–kubevirt-exit-on-failure
KubeVirt fails run if VMs still have false status
enum
True/False
false
–kubevirt-node-node
Only track VMs in KubeVirt on given node name
string
-
false
–krkn-debug
Enables debug mode for Krkn
enum
True/False
False
Note
For setting the TELEMETRY_ARCHIVE_SIZE,the higher the number of archive files will be produced and uploaded (and processed by backup_thread simultaneously| .For unstable/slow connection is better to keep this value low increasing the number of backup_threads, in this way, on upload failure, the retry will happen only on the failed chunk without affecting the whole upload.
NOTE: For clusters with AWS make sure AWS CLI is installed and properly configured using an AWS account. This should set a configuration file at $HOME/.aws/config for your the AWS account. If you have multiple profiles configured on AWS, you can change the profile by setting export AWS_DEFAULT_PROFILE=<profile-name>
exportAWS_DEFAULT_REGION=<aws-region>
This configuration will work for self managed AWS, ROSA and Rosa-HCP
GCP
NOTE: For clusters with GCP make sure GCP CLI is installed.
A google service account is required to give proper authentication to GCP for node actions. See here for how to create a service account.
NOTE: A user with ‘resourcemanager.projects.setIamPolicy’ permission is required to grant project-level permissions to the service account.
After creating the service account you will need to enable the account using the following: export GOOGLE_APPLICATION_CREDENTIALS="<serviceaccount.json>" or use gcloud init
In krkn-hub, you’ll need to both set the environemnt variable and also copy the file to the local container
NOTE: For clusters with Openstack Cloud, ensure to create and source the OPENSTACK RC file to set the OPENSTACK environment variables from the server where Kraken runs.
Azure
NOTE: You will need to create a service principal and give it the correct access, see here for creating the service principal and setting the proper permissions.
To properly run the service principal requires “Azure Active Directory Graph/Application.ReadWrite.OwnedBy” api permission granted and “User Access Administrator”.
Before running you will need to set the following:
export AZURE_SUBSCRIPTION_ID=<subscription_id>
export AZURE_TENANT_ID=<tenant_id>
export AZURE_CLIENT_SECRET=<client secret>
export AZURE_CLIENT_ID=<client id>
Note
This configuration will only work for self managed Azure, not ARO. ARO service puts a deny assignment in place over cluster managed resources, that only allows the ARO service itself to modify the VM resources. This is a capability unique to Azure and the structure of the service to prevent customers from hurting themselves. Refer to the links below for more documentation around this.
Scenario to block the traffic ( Ingress/Egress ) of an application matching the labels for the specified duration of time to understand the behavior of the service/other services which depend on it during downtime. This helps with planning the requirements accordingly, be it improving the timeouts or tweaking the alerts etc.
You can add in your applications URL into the [health checks section](../../krkn/config.md#health-checks) of the config to track the downtime of your application during this scenario
Rollback Scenario Support
Krkn supports rollback for Application outages. For more details, please refer to the Rollback Scenarios documentation.
Debugging steps in case of failures
Kraken creates a network policy blocking the ingress/egress traffic to create an outage, in case of failures before reverting back the network policy, you can delete it manually by executing the following commands to stop the outage:
application_outage:# Scenario to create an outage of an application by blocking trafficduration:600# Duration in seconds after which the routes will be accessiblenamespace:<namespace-with-application> # Namespace to target - all application routes will go inaccessible if pod selector is emptypod_selector:{app:foo} # Pods to targetexclude_label:""# Optional label selector to exclude pods. Supports dict, string, or list formatblock:[Ingress, Egress] # It can be Ingress or Egress or Ingress, Egress
How to Use Plugin Name
Add the plugin name to the list of chaos_scenarios section in the config/config.yaml file
kraken:kubeconfig_path:~/.kube/config # Path to kubeconfig..chaos_scenarios:- application_outages_scenarios:- scenarios/<scenario_name>.yaml
Note
You can specify multiple scenario files of the same type by adding additional paths to the list:
You can also combine multiple different scenario types in the same config.yaml file. Scenario types can be specified in any order, and you can include the same scenario type multiple times:
kraken:chaos_scenarios:- application_outages_scenarios:- scenarios/app-outage.yaml- pod_disruption_scenarios:- scenarios/pod-kill.yaml- container_scenarios:- scenarios/container-kill.yaml- application_outages_scenarios:# Same type can appear multiple times- scenarios/app-outage-2.yaml
Run
python run_kraken.py --config config/config.yaml
This scenario disrupts the traffic to the specified application to be able to understand the impact of the outage on the dependent service/user experience. Refer docs for more details.
Run
If enabling Cerberus to monitor the cluster and pass/fail the scenario post chaos, refer docs. Make sure to start it before injecting the chaos and set CERBERUS_ENABLED environment variable for the chaos injection container to autoconnect.
–env-host: This option is not available with the remote Podman client, including Mac and Windows (excluding WSL2) machines.
Without the –env-host option you’ll have to set each environment variable on the podman command line like -e <VARIABLE>=<value>
Because the container runs with a non-root user, ensure the kube config is globally readable before mounting it in the container. You can achieve this with the following commands:
The following environment variables can be set on the host running the container to tweak the scenario/faults being injected:
Example if –env-host is used:
export <parameter_name>=<value>
OR on the command line like example:
-e <VARIABLE>=<value>
See list of variables that apply to all scenarios here that can be used/set in addition to these scenario specific variables
Parameter
Description
Default
DURATION
Duration in seconds after which the routes will be accessible
600
NAMESPACE
Namespace to target - all application routes will go inaccessible if pod selector is empty ( Required )
No default
POD_SELECTOR
Pods to target. For example “{app: foo}”
No default
EXCLUDE_LABEL
Pods to exclude after getting list of pods from POD_SELECTOR to target. For example “{app: foo}”
No default
BLOCK_TRAFFIC_TYPE
It can be Ingress or Egress or Ingress, Egress ( needs to be a list )
[Ingress, Egress]
Note
Defining the NAMESPACE parameter is required for running this scenario while the pod_selector is optional. In case of using pod selector to target a particular application, make sure to define it using the following format with a space between key and value: “{key: value}”.
Note
In case of using custom metrics profile or alerts profile when CAPTURE_METRICS or ENABLE_ALERTS is enabled, mount the metrics profile from the host on which the container is run using podman/docker under /home/krkn/kraken/config/metrics-aggregated.yaml and /home/krkn/kraken/config/alerts.
Namespace to target - all application routes will go inaccessible if pod selector is empty
string
True
--chaos-duration
Set chaos duration (in sec) as desired
number
False
600
--pod-selector
Pods to target. For example “{app: foo}”
string
False
--exclude-label
Pods to exclude after using pod-selector to target. For example “{app: foo}”
string
False
--block-traffic-type
It can be [Ingress] or [Egress] or [Ingress, Egress]
string
False
“[Ingress, Egress]”
To see all available scenario options
krknctl run application-outages --help
Demo
See a demo of this scenario:
11.5 - Aurora Disruption Scenario
This scenario blocks a pod’s outgoing MySQL and PostgreSQL traffic, effectively preventing it from connecting to any AWS Aurora SQL engine. It works just as well for standard MySQL and PostgreSQL connections too.
This uses the pod network filter scenario but set with specific parameters to disrupt aurora
How to Run Aurora Disruption Scenarios
Choose your preferred method to run aurora disruption scenarios:
This scenario blocks a pod’s outgoing MySQL and PostgreSQL traffic, effectively preventing it from connecting to any AWS Aurora SQL engine. It works just as well for standard MySQL and PostgreSQL connections too.
You can also combine multiple different scenario types in the same config.yaml file. Scenario types can be specified in any order, and you can include the same scenario type multiple times:
kraken:chaos_scenarios:- network_chaos_ng_scenarios:- scenarios/aurora-disruption.yaml- pod_disruption_scenarios:- scenarios/pod-kill.yaml- container_scenarios:- scenarios/container-kill.yaml- network_chaos_ng_scenarios:# Same type can appear multiple times- scenarios/aurora-disruption-2.yaml
Run
python run_kraken.py --config config/config.yaml
This scenario disrupts a targeted zone in the public cloud by blocking egress and ingress traffic to understand the impact on both Kubernetes/OpenShift platforms control plane as well as applications running on the worker nodes in that zone. More information is documented here
Kraken uses the `oc exec` command to `kill` specific containers in a pod.
This can be based on the pods namespace or labels. If you know the exact object you want to kill, you can also specify the specific container name or pod name in the scenario yaml file.
These scenarios are in a simple yaml format that you can manipulate to run your specific tests or use the pre-existing scenarios to see how it works.
Recovery Time Metrics in Krkn Telemetry
Krkn tracks three key recovery time metrics for each affected container:
pod_rescheduling_time - The time (in seconds) that the Kubernetes cluster took to reschedule the pod after it was killed. This measures the cluster’s scheduling efficiency and includes the time from pod deletion until the replacement pod is scheduled on a node. In some cases when the container gets killed, the pod won’t fully reschedule so the pod rescheduling might be 0.0 seconds
pod_readiness_time - The time (in seconds) the pod took to become ready after being scheduled. This measures application startup time, including container image pulls, initialization, and readiness probe success.
total_recovery_time - The total amount of time (in seconds) from pod deletion until the replacement pod became fully ready and available to serve traffic. This is the sum of rescheduling time and readiness time.
These metrics appear in the telemetry output under PodsStatus.recovered for successfully recovered pods. Pods that fail to recover within the timeout period appear under PodsStatus.unrecovered without timing data.
The following are the components of Kubernetes for which a basic chaos scenario config exists today.
scenarios:- name:"<name of scenario>"namespace:"<specific namespace>"# can specify "*" if you want to find in all namespaceslabel_selector:"<label of pod(s)>"container_name:"<specific container name>"# This is optional, can take out and will kill all containers in all pods found under namespace and labelpod_names:# This is optional, can take out and will select all pods with given namespace and label- <pod_name>exclude_label:"<label to exclude pods from chaos>"# Optional: pods matching this label will be excluded from disruptioncount:<number of containers to disrupt, default=1>action:<kill signal to run. For example 1 ( hang up ) or 9. Default is set to 1>expected_recovery_time:<number of seconds to wait for container to be running again> (defaults to 120seconds)
How to Use Plugin Name
Add the plugin name to the list of chaos_scenarios section in the config/config.yaml file
kraken:kubeconfig_path:~/.kube/config # Path to kubeconfig..chaos_scenarios:- container_scenarios:- scenarios/<scenario_name>.yaml
Note
You can specify multiple scenario files of the same type by adding additional paths to the list:
You can also combine multiple different scenario types in the same config.yaml file. Scenario types can be specified in any order, and you can include the same scenario type multiple times:
kraken:chaos_scenarios:- container_scenarios:- scenarios/container-kill.yaml- pod_disruption_scenarios:- scenarios/pod-kill.yaml- node_scenarios:- scenarios/node-reboot.yaml- container_scenarios:# Same type can appear multiple times- scenarios/container-kill-2.yaml
Run
python run_kraken.py --config config/config.yaml
This scenario disrupts the containers matching the label in the specified namespace on a Kubernetes/OpenShift cluster.
Run
If enabling Cerberus to monitor the cluster and pass/fail the scenario post chaos, refer docs. Make sure to start it before injecting the chaos and set CERBERUS_ENABLED environment variable for the chaos injection container to autoconnect.
$ podman run \
--name=<container_name> \
--net=host \
--pull=always \
--env-host=true\
-v <path-to-kube-config>:/home/krkn/.kube/config:Z \
-d containers.krkn-chaos.dev/krkn-chaos/krkn-hub:container-scenarios
$ podman logs -f <container_name or container_id> # Streams Kraken logs$ podman inspect <container-name or container-id> \
--format "{{.State.ExitCode}}"# Outputs exit code which can considered as pass/fail for the scenario
Note
–env-host: This option is not available with the remote Podman client, including Mac and Windows (excluding WSL2) machines.
Without the –env-host option you’ll have to set each environment variable on the podman command line like -e <VARIABLE>=<value>
$ docker run $(./get_docker_params.sh)\
--name=<container_name> \
--net=host \
--pull=always \
-v <path-to-kube-config>:/home/krkn/.kube/config:Z \
-d containers.krkn-chaos.dev/krkn-chaos/krkn-hub:container-scenarios
$ docker run \
-e <VARIABLE>=<value> \
--net=host \
--pull=always \
-v <path-to-kube-config>:/home/krkn/.kube/config:Z \
-d containers.krkn-chaos.dev/krkn-chaos/krkn-hub:container-scenarios
$ docker logs -f <container_name or container_id> # Streams Kraken logs$ docker inspect <container-name or container-id> \
--format "{{.State.ExitCode}}"# Outputs exit code which can considered as pass/fail for the scenario
Tip
Because the container runs with a non-root user, ensure the kube config is globally readable before mounting it in the container. You can achieve this with the following commands:
kubectl config view --flatten > ~/kubeconfig && chmod 444 ~/kubeconfig && docker run $(./get_docker_params.sh) --name=<container_name> --net=host --pull=always -v ~kubeconfig:/home/krkn/.kube/config:Z -d containers.krkn-chaos.dev/krkn-chaos/krkn-hub:<scenario>
Supported parameters
The following environment variables can be set on the host running the container to tweak the scenario/faults being injected:
Example if –env-host is used:
export <parameter_name>=<value>
OR on the command line like example:
-e <VARIABLE>=<value>
See list of variables that apply to all scenarios here that can be used/set in addition to these scenario specific variables
Parameter
Description
Default
NAMESPACE
Targeted namespace in the cluster
openshift-etcd
LABEL_SELECTOR
Label of the container(s) to target
k8s-app=etcd
EXCLUDE_LABEL
Pods to exclude after getting list of pods from LABEL_SELECTOR to target. For example “app=foo”
No default
DISRUPTION_COUNT
Number of container to disrupt
1
CONTAINER_NAME
Name of the container to disrupt
etcd
ACTION
kill signal to run. For example 1 ( hang up ) or 9
1
EXPECTED_RECOVERY_TIME
Time to wait before checking if all containers that were affected recover properly
60
Note
Set NAMESPACE environment variable to openshift-.* to pick and disrupt pods randomly in openshift system namespaces, the DAEMON_MODE can also be enabled to disrupt the pods every x seconds in the background to check the reliability.
Note
In case of using custom metrics profile or alerts profile when CAPTURE_METRICS or ENABLE_ALERTS is enabled, mount the metrics profile from the host on which the container is run using podman/docker under /home/krkn/kraken/config/metrics-aggregated.yaml and /home/krkn/kraken/config/alerts.
You can also combine multiple different scenario types in the same config.yaml file. Scenario types can be specified in any order, and you can include the same scenario type multiple times:
kraken:chaos_scenarios:- network_chaos_ng_scenarios:- scenarios/dns-outage.yaml- pod_disruption_scenarios:- scenarios/pod-kill.yaml- container_scenarios:- scenarios/container-kill.yaml- network_chaos_ng_scenarios:# Same type can appear multiple times- scenarios/dns-outage-2.yaml
This scenario creates an outgoing firewall rule on specific nodes in your cluster, chosen by node name or a selector. This rule blocks connections to AWS EFS, leading to a temporary failure of any EFS volumes mounted on those affected nodes.
How to Run EFS Disruption Scenarios
Choose your preferred method to run EFS disruption scenarios:
This scenario creates an outgoing firewall rule on specific nodes in your cluster, chosen by node name or a selector. This rule blocks connections to AWS EFS, leading to a temporary failure of any EFS volumes mounted on those affected nodes.
You can also combine multiple different scenario types in the same config.yaml file. Scenario types can be specified in any order, and you can include the same scenario type multiple times:
kraken:chaos_scenarios:- network_chaos_ng_scenarios:- scenarios/efs-disruption.yaml- pod_disruption_scenarios:- scenarios/pod-kill.yaml- node_scenarios:- scenarios/node-reboot.yaml- network_chaos_ng_scenarios:# Same type can appear multiple times- scenarios/efs-disruption-2.yaml
Run
python run_kraken.py --config config/config.yaml
This scenario disrupts a targeted zone in the public cloud by blocking egress and ingress traffic to understand the impact on both Kubernetes/OpenShift platforms control plane as well as applications running on the worker nodes in that zone. More information is documented here
This scenario isolates an etcd node by blocking its network traffic. This action forces an etcd leader re-election. Once the scenario concludes, the cluster should temporarily exhibit a split-brain condition, with two etcd leaders active simultaneously. This is particularly useful for testing the etcd cluster’s resilience under such a challenging state.
DANGER
This scenario carries a significant risk: it might break the cluster API, making it impossible to automatically revert the applied network rules. The iptables rules will be printed to the console, allowing for manual reversal via a shell on the affected node. This scenario is best suited for disposable clusters and should be used at your own risk.
How to Run ETCD Split Brain Scenarios
Choose your preferred method to run ETCD split brain scenarios:
This scenario isolates an etcd node by blocking its network traffic. This action forces an etcd leader re-election. Once the scenario concludes, the cluster should temporarily exhibit a split-brain condition, with two etcd leaders active simultaneously. This is particularly useful for testing the etcd cluster’s resilience under such a challenging state.
You can also combine multiple different scenario types in the same config.yaml file. Scenario types can be specified in any order, and you can include the same scenario type multiple times:
kraken:chaos_scenarios:- network_chaos_ng_scenarios:- scenarios/etcd-split-brain.yaml- pod_disruption_scenarios:- scenarios/pod-kill.yaml- node_scenarios:- scenarios/node-reboot.yaml- network_chaos_ng_scenarios:# Same type can appear multiple times- scenarios/etcd-split-brain-2.yaml
Run
python run_kraken.py --config config/config.yaml
DANGER
This scenario carries a significant risk: it might break the cluster API, making it impossible to automatically revert the applied network rules. The iptables rules will be printed to the console, allowing for manual reversal via a shell on the affected node. This scenario is best suited for disposable clusters and should be used at your own risk.
Hog Scenarios are designed to push the limits of memory, CPU, or I/O on one or more nodes in your cluster. They also serve to evaluate whether your cluster can withstand rogue pods that excessively consume resources without any limits.
These scenarios involve deploying one or more workloads in the cluster. Based on the specific configuration, these workloads will use a predetermined amount of resources for a specified duration.
Config Options
Common options
Option
Type
Description
duration
number
the duration of the stress test in seconds
workers
number (Optional)
the number of threads instantiated by stress-ng, if left empty the number of workers will match the number of available cores in the node.
hog-type
string (Enum)
can be cpu, memory or io.
image
string
the container image of the stress workload (quay.io/krkn-chaos/krkn-hog)
namespace
string
the namespace where the stress workload will be deployed
node-selector
string (Optional)
defines the node selector for choosing target nodes. If not specified, one schedulable node in the cluster will be chosen at random. If multiple nodes match the selector, all of them will be subjected to stress. If number-of-nodes is specified, that many nodes will be randomly selected from those identified by the selector.
taints
list (Optional) default []
list of taints for which tolerations need to created. Example: [“node-role.kubernetes.io/master:NoSchedule”]
number-of-nodes
number (Optional)
restricts the number of selected nodes by the selector
Krkn supports rollback for all available Hog scenarios. For more details, please refer to the Rollback Scenarios documentation.
11.10.1 - CPU Hog Scenario
Overview
The CPU Hog scenario is designed to create CPU pressure on one or more nodes in your Kubernetes/OpenShift cluster for a specified duration. This scenario helps you test how your cluster and applications respond to high CPU utilization.
How It Works
The scenario deploys a stress workload pod on targeted nodes. These pods use stress-ng to consume CPU resources according to your configuration. The workload runs for a specified duration and then terminates, allowing you to observe your cluster’s behavior under CPU stress.
When to Use
Use the CPU Hog scenario to:
Test your cluster’s ability to handle CPU resource contention
Validate that CPU resource limits and quotas are properly configured
Evaluate the impact of CPU pressure on application performance
Test whether your monitoring and alerting systems properly detect CPU saturation
Verify that the Kubernetes scheduler correctly handles CPU-constrained nodes
Simulate scenarios where rogue pods consume excessive CPU without limits
In addition to the common hog scenario options, you can specify the below options in your scenario configuration to specificy the amount of CPU to hog on a certain worker node
Option
Type
Description
cpu-load-percentage
number
the amount of cpu that will be consumed by the hog
cpu-method
string
reflects the cpu load strategy adopted by stress-ng, please refer to the stress-ng documentation for all the available options
Usage
To enable hog scenarios edit the kraken config file, go to the section kraken -> chaos_scenarios of the yaml structure
and add a new element to the list named hog_scenarios then add the desired scenario
pointing to the hog.yaml file.
You can also combine multiple different scenario types in the same config.yaml file. Scenario types can be specified in any order, and you can include the same scenario type multiple times:
kraken:chaos_scenarios:- hog_scenarios:- scenarios/kube/cpu-hog.yml- pod_disruption_scenarios:- scenarios/pod-kill.yaml- node_scenarios:- scenarios/node-reboot.yaml- hog_scenarios:# Same type can appear multiple times- scenarios/kube/cpu-hog-2.yml
Run
python run_kraken.py --config config/config.yaml
This scenario hogs the cpu on the specified node on a Kubernetes/OpenShift cluster for a specified duration. For more information refer the following documentation.
Run
If enabling Cerberus to monitor the cluster and pass/fail the scenario post chaos, refer docs. Make sure to start it before injecting the chaos and set CERBERUS_ENABLED environment variable for the chaos injection container to autoconnect.
$ podman run \
--name=<container_name> \
--net=host \
--pull=always \
--env-host=true\
-v <path-to-kube-config>:/home/krkn/.kube/config:Z \
-d containers.krkn-chaos.dev/krkn-chaos/krkn-hub:node-cpu-hog
$ podman logs -f <container_name or container_id> # Streams Kraken logs$ podman inspect <container-name or container-id> \
--format "{{.State.ExitCode}}"# Outputs exit code which can considered as pass/fail for the scenario
Note
–env-host: This option is not available with the remote Podman client, including Mac and Windows (excluding WSL2) machines.
Without the –env-host option you’ll have to set each environment variable on the podman command line like -e <VARIABLE>=<value>
$ docker run $(./get_docker_params.sh)\
--name=<container_name> \
--net=host \
--pull=always \
-v <path-to-kube-config>:/home/krkn/.kube/config:Z \
-d containers.krkn-chaos.dev/krkn-chaos/krkn-hub:node-cpu-hog
$ docker run \
-e <VARIABLE>=<value> \
--net=host \
--pull=always \
-v <path-to-kube-config>:/home/krkn/.kube/config:Z \
-d containers.krkn-chaos.dev/krkn-chaos/krkn-hub:node-cpu-hog
$ docker logs -f <container_name or container_id> # Streams Kraken logs$ docker inspect <container-name or container-id> \
--format "{{.State.ExitCode}}"# Outputs exit code which can considered as pass/fail for the scenario
Tip
Because the container runs with a non-root user, ensure the kube config is globally readable before mounting it in the container. You can achieve this with the following commands:
kubectl config view --flatten > ~/kubeconfig && chmod 444 ~/kubeconfig && docker run $(./get_docker_params.sh) --name=<container_name> --net=host --pull=always -v ~kubeconfig:/home/krkn/.kube/config:Z -d containers.krkn-chaos.dev/krkn-chaos/krkn-hub:<scenario>
Supported parameters
The following environment variables can be set on the host running the container to tweak the scenario/faults being injected:
Example if –env-host is used:
export <parameter_name>=<value>
OR on the command line like example:
-e <VARIABLE>=<value>
See list of variables that apply to all scenarios here that can be used/set in addition to these scenario specific variables
Parameter
Description
Default
TOTAL_CHAOS_DURATION
Set chaos duration (in sec) as desired
60
NODE_CPU_CORE
Number of cores (workers) of node CPU to be consumed
2
NODE_CPU_PERCENTAGE
Percentage of total cpu to be consumed
50
NAMESPACE
Namespace where the scenario container will be deployed
default
NODE_SELECTOR
Defines the node selector for choosing target nodes. If not specified, one schedulable node in the cluster will be chosen at random. If multiple nodes match the selector, all of them will be subjected to stress. If number-of-nodes is specified, that many nodes will be randomly selected from those identified by the selector.
""
TAINTS
List of taints for which tolerations need to created. Example: [“node-role.kubernetes.io/master:NoSchedule”]
[]
NUMBER_OF_NODES
Restricts the number of selected nodes by the selector
""
IMAGE
The container image of the stress workload
quay.io/krkn-chaos/krkn-hog
Note
In case of using custom metrics profile or alerts profile when CAPTURE_METRICS or ENABLE_ALERTS is enabled, mount the metrics profile from the host on which the container is run using podman/docker under /home/krkn/kraken/config/metrics-aggregated.yaml and /home/krkn/kraken/config/alerts.
Number of cores (workers) of node CPU to be consumed
number
--cpu-percentage
Percentage of total cpu to be consumed
number
50
--namespace
Namespace where the scenario container will be deployed
string
default
--node-selector
Node selector where the scenario containers will be scheduled in the format “=”. NOTE: Will be instantiated a container per each node selected with the same scenario options. If left empty a random node will be selected
string
--taints
List of taints for which tolerations need to created. For example [“node-role.kubernetes.io/master:NoSchedule”]"
string
[]
--number-of-nodes
restricts the number of selected nodes by the selector
number
--image
The hog container image. Can be changed if the hog image is mirrored on a private repository
string
quay.io/krkn-chaos/krkn-hog
To see all available scenario options
krknctl run node-cpu-hog --help
Demo
You can find a link to a demo of the scenario here
11.10.2 - IO Hog Scenario
Overview
The IO Hog scenario is designed to create disk I/O pressure on one or more nodes in your Kubernetes/OpenShift cluster for a specified duration. This scenario helps you test how your cluster and applications respond to high disk I/O utilization and storage-related bottlenecks.
How It Works
The scenario deploys a stress workload pod on targeted nodes. These pods use stress-ng to perform intensive write operations to disk, consuming I/O resources according to your configuration. The scenario supports attaching node paths to the pod as a hostPath volume or using custom pod volume definitions, allowing you to test I/O pressure on specific storage targets.
When to Use
Use the IO Hog scenario to:
Test your cluster’s behavior under disk I/O pressure
Validate that I/O resource limits are properly configured
Evaluate the impact of disk I/O contention on application performance
Test whether your monitoring systems properly detect disk saturation
Verify that storage performance meets requirements under stress
Simulate scenarios where pods perform excessive disk writes
Test the resilience of persistent volume configurations
The size of each individual write operation performed by the stressor
io-write-bytes
string
The total amount of data that will be written by the stressor. Can be specified as a percentage (%) of free space on the filesystem or in absolute units (b, k, m, g for Bytes, KBytes, MBytes, GBytes)
io-target-pod-folder
string
The path within the pod where the volume will be mounted
io-target-pod-volume
dictionary
The pod volume definition that will be stressed by the scenario (typically a hostPath volume)
WARNING
Modifying the structure of io-target-pod-volume might alter how the hog operates, potentially rendering it ineffective.
Example Values
io-block-size: "1m" - Write in 1 megabyte blocks
io-block-size: "4k" - Write in 4 kilobyte blocks
io-write-bytes: "50%" - Write data equal to 50% of available free space
io-write-bytes: "10g" - Write 10 gigabytes of data
How to Run IO Hog Scenarios
Choose your preferred method to run IO hog scenarios:
To enable this plugin add the pointer to the scenario input file scenarios/kube/io-hog.yaml as described in the
Usage section.
In addition to the common hog scenario options, you can specify the below options in your scenario configuration to target specific pod IO
Option
Type
Description
io-block-size
string
the block size written by the stressor
io-write-bytes
string
the total amount of data that will be written by the stressor. The size can be specified as % of free space on the file system or in units of Bytes, KBytes, MBytes and GBytes using the suffix b, k, m or g
io-target-pod-folder
string
the folder where the volume will be mounted in the pod
io-target-pod-volume
dictionary
the pod volume definition that will be stressed by the scenario.
WARNING
Modifying the structure of io-target-pod-volume might alter how the hog operates, potentially rendering it ineffective.
Usage
To enable hog scenarios edit the kraken config file, go to the section kraken -> chaos_scenarios of the yaml structure
and add a new element to the list named hog_scenarios then add the desired scenario
pointing to the hog.yaml file.
You can also combine multiple different scenario types in the same config.yaml file. Scenario types can be specified in any order, and you can include the same scenario type multiple times:
kraken:chaos_scenarios:- hog_scenarios:- scenarios/kube/io-hog.yml- pod_disruption_scenarios:- scenarios/pod-kill.yaml- node_scenarios:- scenarios/node-reboot.yaml- hog_scenarios:# Same type can appear multiple times- scenarios/kube/io-hog-2.yml
Run
python run_kraken.py --config config/config.yaml
This scenario hogs the IO on the specified node on a Kubernetes/OpenShift cluster for a specified duration. For more information refer the following documentation.
Run
If enabling Cerberus to monitor the cluster and pass/fail the scenario post chaos, refer docs. Make sure to start it before injecting the chaos and set CERBERUS_ENABLED environment variable for the chaos injection container to autoconnect.
$ podman run \
--name=<container_name> \
--net=host \
--pull=always \
--env-host=true\
-v <path-to-kube-config>:/root/.kube/config:Z \
-d containers.krkn-chaos.dev/krkn-chaos/krkn-hub:node-io-hog
$ podman logs -f <container_name or container_id> # Streams Kraken logs$ podman inspect <container-name or container-id> \
--format "{{.State.ExitCode}}"# Outputs exit code which can considered as pass/fail for the scenario
Note
–env-host: This option is not available with the remote Podman client, including Mac and Windows (excluding WSL2) machines.
Without the –env-host option you’ll have to set each environment variable on the podman command line like -e <VARIABLE>=<value>
$ docker run $(./get_docker_params.sh)\
--name=<container_name> \
--net=host \
--pull=always \
-v <path-to-kube-config>:/root/.kube/config:Z \
-d containers.krkn-chaos.dev/krkn-chaos/krkn-hub:node-io-hog
$ docker run \
-e <VARIABLE>=<value> \
--net=host \
--pull=always \
-v <path-to-kube-config>:/root/.kube/config:Z \
-d containers.krkn-chaos.dev/krkn-chaos/krkn-hub:node-io-hog
$ docker logs -f <container_name or container_id> # Streams Kraken logs$ docker inspect <container-name or container-id> \
--format "{{.State.ExitCode}}"# Outputs exit code which can considered as pass/fail for the scenario
Tip
Because the container runs with a non-root user, ensure the kube config is globally readable before mounting it in the container. You can achieve this with the following commands:
kubectl config view --flatten > ~/kubeconfig && chmod 444 ~/kubeconfig && docker run $(./get_docker_params.sh) --name=<container_name> --net=host --pull=always -v ~kubeconfig:/home/krkn/.kube/config:Z -d containers.krkn-chaos.dev/krkn-chaos/krkn-hub:<scenario>
Supported parameters
The following environment variables can be set on the host running the container to tweak the scenario/faults being injected:
Example if –env-host is used:
export <parameter_name>=<value>
OR on the command line like example:
-e <VARIABLE>=<value>
See list of variables that apply to all scenarios here that can be used/set in addition to these scenario specific variables
Parameter
Description
Default
TOTAL_CHAOS_DURATION
Set chaos duration (in sec) as desired
180
IO_BLOCK_SIZE
string size of each write in bytes. Size can be from 1 byte to 4m
1m
IO_WORKERS
Number of stressorts
5
IO_WRITE_BYTES
string writes N bytes for each hdd process. The size can be expressed as % of free space on the file system or in units of Bytes, KBytes, MBytes and GBytes using the suffix b, k, m or g
10m
NAMESPACE
Namespace where the scenario container will be deployed
default
NODE_SELECTOR
defines the node selector for choosing target nodes. If not specified, one schedulable node in the cluster will be chosen at random. If multiple nodes match the selector, all of them will be subjected to stress. If number-of-nodes is specified, that many nodes will be randomly selected from those identified by the selector.
""
TAINTS
List of taints for which tolerations need to created. Example: [“node-role.kubernetes.io/master:NoSchedule”]
[]
NODE_MOUNT_PATH
the local path in the node that will be mounted in the pod and that will be filled by the scenario
""
NUMBER_OF_NODES
restricts the number of selected nodes by the selector
""
IMAGE
the container image of the stress workload
quay.io/krkn-chaos/krkn-hog
Note
In case of using custom metrics profile or alerts profile when CAPTURE_METRICS or ENABLE_ALERTS is enabled, mount the metrics profile from the host on which the container is run using podman/docker under /home/krkn/kraken/config/metrics-aggregated.yaml and /home/krkn/kraken/config/alerts.
sSze of each write in bytes. Size can be from 1 byte to 4 Megabytes (allowed suffix are b,k,m)
string
1m
--io-workers
Number of stressor instances
number
5
--io-write-bytes
string writes N bytes for each hdd process. The size can be expressed as % of free space on the file system or in units of Bytes, KBytes, MBytes and GBytes using the suffix b, k, m or g
string
10m
--node-mount-path
the path in the node that will be mounted in the pod and where the io hog will be executed. NOTE: be sure that kubelet has the rights to write in that node path
string
/root
--namespace
Namespace where the scenario container will be deployed
string
default
--node-selector
Node selector where the scenario containers will be scheduled in the format “=”. NOTE: Will be instantiated a container per each node selected with the same scenario options. If left empty a random node will be selected
string
--taints
List of taints for which tolerations need to created. For example [“node-role.kubernetes.io/master:NoSchedule”]"
string
[]
--number-of-nodes
restricts the number of selected nodes by the selector
number
--image
The hog container image. Can be changed if the hog image is mirrored on a private repository
string
quay.io/krkn-chaos/krkn-hog
To see all available scenario options
krknctl run node-io-hog --help
11.10.3 - Memory Hog Scenario
Overview
The Memory Hog scenario is designed to create virtual memory pressure on one or more nodes in your Kubernetes/OpenShift cluster for a specified duration. This scenario helps you test how your cluster and applications respond to memory exhaustion and pressure conditions.
How It Works
The scenario deploys a stress workload pod on targeted nodes. These pods use stress-ng to allocate and consume memory resources according to your configuration. The workload runs for a specified duration, allowing you to observe how your cluster handles memory pressure, OOM (Out of Memory) conditions, and eviction scenarios.
When to Use
Use the Memory Hog scenario to:
Test your cluster’s behavior under memory pressure
Validate that memory resource limits and quotas are properly configured
Test pod eviction policies when nodes run out of memory
Verify that the kubelet correctly evicts pods based on memory pressure
Evaluate the impact of memory contention on application performance
Test whether your monitoring systems properly detect memory saturation
Simulate scenarios where rogue pods consume excessive memory without limits
Validate that memory-based horizontal pod autoscaling works correctly
The amount of memory that the scenario will attempt to allocate and consume. Can be specified as a percentage (%) of available memory or in absolute units (b, k, m, g for Bytes, KBytes, MBytes, GBytes)
Example Values
memory-vm-bytes: "80%" - Consume 80% of available memory
memory-vm-bytes: "2g" - Consume 2 gigabytes of memory
memory-vm-bytes: "512m" - Consume 512 megabytes of memory
How to Run Memory Hog Scenarios
Choose your preferred method to run memory hog scenarios:
To enable this plugin add the pointer to the scenario input file scenarios/kube/memory-hog.yml as described in the
Usage section.
In addition to the common hog scenario options, you can specify the below options in your scenario configuration to specificy the amount of memory to hog on a certain worker node
Option
Type
Description
memory-vm-bytes
string
the amount of memory that the scenario will try to hog.The size can be specified as % of free space on the file system or in units of Bytes, KBytes, MBytes and GBytes using the suffix b, k, m or g
Usage
To enable hog scenarios edit the kraken config file, go to the section kraken -> chaos_scenarios of the yaml structure
and add a new element to the list named hog_scenarios then add the desired scenario
pointing to the hog.yaml file.
You can also combine multiple different scenario types in the same config.yaml file. Scenario types can be specified in any order, and you can include the same scenario type multiple times:
kraken:chaos_scenarios:- hog_scenarios:- scenarios/kube/memory-hog.yml- pod_disruption_scenarios:- scenarios/pod-kill.yaml- node_scenarios:- scenarios/node-reboot.yaml- hog_scenarios:# Same type can appear multiple times- scenarios/kube/memory-hog-2.yml
Run
python run_kraken.py --config config/config.yaml
This scenario hogs the memory on the specified node on a Kubernetes/OpenShift cluster for a specified duration. For more information refer the following documentation.
Run
If enabling Cerberus to monitor the cluster and pass/fail the scenario post chaos, refer docs. Make sure to start it before injecting the chaos and set CERBERUS_ENABLED environment variable for the chaos injection container to autoconnect.
$ podman run \
--name=<container_name> \
--net=host \
--pull=always \
--env-host=true\
-v <path-to-kube-config>:/home/krkn/.kube/config:Z \
-d containers.krkn-chaos.dev/krkn-chaos/krkn-hub:node-memory-hog
$ podman logs -f <container_name or container_id> # Streams Kraken logs$ podman inspect <container-name or container-id> \
--format "{{.State.ExitCode}}"# Outputs exit code which can considered as pass/fail for the scenario
Note
–env-host: This option is not available with the remote Podman client, including Mac and Windows (excluding WSL2) machines.
Without the –env-host option you’ll have to set each environment variable on the podman command line like -e <VARIABLE>=<value>
$ docker run $(./get_docker_params.sh)\
--name=<container_name> \
--net=host \
--pull=always \
-v <path-to-kube-config>:/home/krkn/.kube/config:Z \
-d containers.krkn-chaos.dev/krkn-chaos/krkn-hub:node-memory-hog
$ docker run \
-e <VARIABLE>=<value> \
--net=host \
--pull=always \
-v <path-to-kube-config>:/home/krkn/.kube/config:Z \
-d containers.krkn-chaos.dev/krkn-chaos/krkn-hub:node-memory-hog
$ docker logs -f <container_name or container_id> # Streams Kraken logs$ docker inspect <container-name or container-id> \
--format "{{.State.ExitCode}}"# Outputs exit code which can considered as pass/fail for the scenario
Tip
Because the container runs with a non-root user, ensure the kube config is globally readable before mounting it in the container. You can achieve this with the following commands:
kubectl config view --flatten > ~/kubeconfig && chmod 444 ~/kubeconfig && docker run $(./get_docker_params.sh) --name=<container_name> --net=host --pull=always -v ~kubeconfig:/home/krkn/.kube/config:Z -d containers.krkn-chaos.dev/krkn-chaos/krkn-hub:<scenario>
Supported parameters
The following environment variables can be set on the host running the container to tweak the scenario/faults being injected:
Example if –env-host is used:
export <parameter_name>=<value>
OR on the command line like example:
-e <VARIABLE>=<value>
See list of variables that apply to all scenarios here that can be used/set in addition to these scenario specific variables
Parameter
Description
Default
TOTAL_CHAOS_DURATION
Set chaos duration (in sec) as desired
60
MEMORY_CONSUMPTION_PERCENTAGE
percentage (expressed with the suffix %) or amount (expressed with the suffix b, k, m or g) of memory to be consumed by the scenario
90%
NUMBER_OF_WORKERS
Total number of workers (stress-ng threads)
1
NAMESPACE
Namespace where the scenario container will be deployed
default
NODE_SELECTOR
defines the node selector for choosing target nodes. If not specified, one schedulable node in the cluster will be chosen at random. If multiple nodes match the selector, all of them will be subjected to stress. If number-of-nodes is specified, that many nodes will be randomly selected from those identified by the selector.
""
TAINTS
List of taints for which tolerations need to created. Example: [“node-role.kubernetes.io/master:NoSchedule”]
[]
NUMBER_OF_NODES
restricts the number of selected nodes by the selector
""
IMAGE
the container image of the stress workload
quay.io/krkn-chaos/krkn-hog
Note
In case of using custom metrics profile or alerts profile when CAPTURE_METRICS or ENABLE_ALERTS is enabled, mount the metrics profile from the host on which the container is run using podman/docker under /home/krkn/kraken/config/metrics-aggregated.yaml and /home/krkn/kraken/config/alerts.
percentage (expressed with the suffix %) or amount (expressed with the suffix b, k, m or g) of memory to be consumed by the scenario
string
90%
--namespace
Namespace where the scenario container will be deployed
string
default
--node-selector
Node selector where the scenario containers will be scheduled in the format “=”. NOTE: Will be instantiated a container per each node selected with the same scenario options. If left empty a random node will be selected
string
--taints
List of taints for which tolerations need to created. For example [“node-role.kubernetes.io/master:NoSchedule”]"
string
[]
--number-of-nodes
restricts the number of selected nodes by the selector
number
--image
The hog container image. Can be changed if the hog image is mirrored on a private repository
string
quay.memory/krkn-chaos/krkn-hog
To see all available scenario options
krknctl run node-memory-hog --help
Demo
You can find a link to a demo of the scenario here
11.11 - KubeVirt VM Outage Scenario
Simulating VM-level disruptions in KubeVirt/OpenShift CNV environments
This scenario enables the simulation of VM-level disruptions in clusters where KubeVirt or OpenShift Containerized Network Virtualization (CNV) is installed. It allows users to delete a Virtual Machine Instance (VMI) to simulate a VM crash and test recovery capabilities.
The kubevirt_vm_outage scenario deletes a specific KubeVirt Virtual Machine Instance (VMI) to simulate a VM crash or outage. This helps users:
Test the resilience of applications running inside VMs
Verify that VM monitoring and recovery mechanisms work as expected
Validate high availability configurations for VM workloads
Understand the impact of sudden VM failures on workloads and the overall system
Prerequisites
Before using this scenario, ensure the following:
KubeVirt or OpenShift CNV is installed in your cluster
The target VMI exists and is running in the specified namespace
Your cluster credentials have sufficient permissions to delete and create VMIs
Parameters
The scenario supports the following parameters:
Parameter
Description
Required
Default
vm_name
The name of the VMI to delete
Yes
N/A
namespace
The namespace where the VMI is located
No
“default”
timeout
How long to wait (in seconds) before attempting recovery for VMI to start running again
No
60
kill_count
How many VMI’s to kill serially
No
1
Expected Behavior
When executed, the scenario will:
Validate that KubeVirt is installed and the target VMI exists
Save the initial state of the VMI
Delete the VMI
Wait for the VMI to become running or hit the timeout
Attempt to recover the VMI:
If the VMI is managed by a VirtualMachine resource with runStrategy: Always, it will automatically recover
If automatic recovery doesn’t occur, the plugin will manually recreate the VMI using the saved state
Validate that the VMI is running again
Note
If the VM is managed by a VirtualMachine resource with runStrategy: Always, KubeVirt will automatically try to recreate the VMI after deletion. In this case, the scenario will wait for this automatic recovery to complete.
Validating VMI SSH Connection
While the kubvirt outage is running you can enable kube virt checks to check the ssh connection to a list of VMIs to test if an outage of one VMI effects any others become unready/unconnectable.
See more details on how to enable these checks in kubevirt checks
Advanced Use Cases
Testing High Availability VM Configurations
This scenario is particularly useful for testing high availability configurations, such as:
Clustered applications running across multiple VMs
VMs with automatic restart policies
Applications with cross-VM resilience mechanisms
Recovery Strategies
The plugin implements two recovery strategies:
Automated Recovery: If the VM is managed by a VirtualMachine resource with runStrategy: Always, the plugin will wait for KubeVirt’s controller to automatically recreate the VMI.
Manual Recovery: If automatic recovery doesn’t occur within the timeout period, the plugin will attempt to manually recreate the VMI using the saved state from before the deletion.
Recovery Time Metrics in Krkn Telemetry
Krkn tracks three key recovery time metrics for each affected VMI:
pod_rescheduling_time - The time (in seconds) that the Kubernetes cluster took to reschedule the VMI after it was deleted. This measures the cluster’s scheduling efficiency and includes the time from VMI deletion until the replacement VMI is scheduled on a node.
pod_readiness_time - The time (in seconds) the VMI took to become ready after being scheduled. This measures VMI startup time, including container image pulls, VM boot process, and readiness probe success.
total_recovery_time - The total amount of time (in seconds) from VMI deletion until the replacement VMI became fully ready and available. This is the sum of rescheduling time and readiness time.
These metrics appear in the telemetry output under PodsStatus.recovered for successfully recovered VMIs. VMIs that fail to recover within the timeout period appear under PodsStatus.unrecovered without timing data.
Krkn supports rollback for KubeVirt VM Outage Scenario. For more details, please refer to the Rollback Scenarios documentation.
Limitations
The scenario currently supports deleting a single VMI at a time
If VM spec changes during the outage window, the manual recovery may not reflect those changes
The scenario doesn’t simulate partial VM failures (e.g., VM freezing) - only complete VM outage
Troubleshooting
If the scenario fails, check the following:
Ensure KubeVirt/CNV is properly installed in your cluster
Verify that the target VMI exists and is running
Check that your credentials have sufficient permissions to delete and create VMIs
Examine the logs for specific error messages
How to Run KubeVirt VM Outage Scenarios
Choose your preferred method to run KubeVirt VM outage scenarios:
KubeVirt VM Outage Scenario in Kraken
The kubevirt_vm_outage scenario in Kraken enables users to simulate VM-level disruptions by deleting a Virtual Machine Instance (VMI) to test resilience and recovery capabilities.
You can also combine multiple different scenario types in the same config.yaml file. Scenario types can be specified in any order, and you can include the same scenario type multiple times:
kraken:chaos_scenarios:- kubevirt_vm_outage:- scenarios/kubevirt/kubevirt-vm-outage.yaml- pod_disruption_scenarios:- scenarios/pod-kill.yaml- node_scenarios:- scenarios/node-reboot.yaml- kubevirt_vm_outage:# Same type can appear multiple times- scenarios/kubevirt/kubevirt-vm-outage-2.yaml
Run
python run_kraken.py --config config/config.yaml
This scenario deletes a VMI matching the namespace and name on a Kubernetes/OpenShift cluster.
Run
If enabling Cerberus to monitor the cluster and pass/fail the scenario post chaos, refer docs. Make sure to start it before injecting the chaos and set CERBERUS_ENABLED environment variable for the chaos injection container to autoconnect.
$ podman run \
--name=<container_name> \
--net=host \
--pull=always \
--env-host=true\
-v <path-to-kube-config>:/home/krkn/.kube/config:Z \
-d containers.krkn-chaos.dev/krkn-chaos/krkn-hub:kubevirt-outage
$ podman logs -f <container_name or container_id> # Streams Kraken logs$ podman inspect <container-name or container-id> \
--format "{{.State.ExitCode}}"# Outputs exit code which can considered as pass/fail for the scenario
Note
–env-host: This option is not available with the remote Podman client, including Mac and Windows (excluding WSL2) machines.
Without the –env-host option you’ll have to set each environment variable on the podman command line like -e <VARIABLE>=<value>
$ docker run $(./get_docker_params.sh)\
--name=<container_name> \
--net=host \
--pull=always \
-v <path-to-kube-config>:/home/krkn/.kube/config:Z \
-d containers.krkn-chaos.dev/krkn-chaos/krkn-hub:kubevirt-outage
$ docker run \
-e <VARIABLE>=<value> \
--net=host \
--pull=always \
-v <path-to-kube-config>:/home/krkn/.kube/config:Z \
-d containers.krkn-chaos.dev/krkn-chaos/krkn-hub:kubevirt-outage
$ docker logs -f <container_name or container_id> # Streams Kraken logs$ docker inspect <container-name or container-id> \
--format "{{.State.ExitCode}}"# Outputs exit code which can considered as pass/fail for the scenario
Tip
Because the container runs with a non-root user, ensure the kube config is globally readable before mounting it in the container. You can achieve this with the following commands:
kubectl config view --flatten > ~/kubeconfig && chmod 444 ~/kubeconfig && docker run $(./get_docker_params.sh) --name=<container_name> --net=host --pull=always -v ~kubeconfig:/home/krkn/.kube/config:Z -d containers.krkn-chaos.dev/krkn-chaos/krkn-hub:<scenario>
Supported parameters
The following environment variables can be set on the host running the container to tweak the scenario/faults being injected:
Example if –env-host is used:
export <parameter_name>=<value>
OR on the command line like example:
-e <VARIABLE>=<value>
See list of variables that apply to all scenarios here that can be used/set in addition to these scenario specific variables
Parameter
Description
Default
NAMESPACE
VMI Namespace to target
""
VM_NAME
VMI name to delete, supports regex
""
TIMEOUT
Timeout to wait for VMI to start running again, will fail if timeout is hit
120
KILL_COUNT
Number of VMI’s to kill (will perform serially)
1
Note
In case of using custom metrics profile or alerts profile when CAPTURE_METRICS or ENABLE_ALERTS is enabled, mount the metrics profile from the host on which the container is run using podman/docker under /home/krkn/kraken/config/metrics-aggregated.yaml and /home/krkn/kraken/config/alerts.
ManagedCluster scenarios leverage ManifestWorks to inject faults into the ManagedClusters.
The following ManagedCluster chaos scenarios are supported:
managedcluster_start_scenario: Scenario to start the ManagedCluster instance.
managedcluster_stop_scenario: Scenario to stop the ManagedCluster instance.
managedcluster_stop_start_scenario: Scenario to stop and then start the ManagedCluster instance.
start_klusterlet_scenario: Scenario to start the klusterlet of the ManagedCluster instance.
stop_klusterlet_scenario: Scenario to stop the klusterlet of the ManagedCluster instance.
stop_start_klusterlet_scenario: Scenario to stop and start the klusterlet of the ManagedCluster instance.
ManagedCluster scenarios can be injected by placing the ManagedCluster scenarios config files under managedcluster_scenarios option in the Kraken config. Refer to managedcluster_scenarios_example config file.
managedcluster_scenarios:- actions:# ManagedCluster chaos scenarios to be injected- managedcluster_stop_start_scenariomanagedcluster_name:cluster1 # ManagedCluster on which scenario has to be injected; can set multiple names separated by comma# label_selector: # When managedcluster_name is not specified, a ManagedCluster with matching label_selector is selected for ManagedCluster chaos scenario injectioninstance_count:1# Number of managedcluster to perform action/select that match the label selectorruns:1# Number of times to inject each scenario under actions (will perform on same ManagedCluster each time)timeout:420# Duration to wait for completion of ManagedCluster scenario injection# For OCM to detect a ManagedCluster as unavailable, have to wait 5*leaseDurationSeconds# (default leaseDurationSeconds = 60 sec)- actions:- stop_start_klusterlet_scenariomanagedcluster_name:cluster1# label_selector:instance_count:1runs:1timeout:60
11.13 - Network Chaos NG Scenarios
This scenario introduce a new infrastructure to refactor and port the current implementation of the network chaos plugins
All the plugins must implement the AbstractNetworkChaosModule abstract class in order to be instantiated and ran by the Netwok Chaos NG plugin.
This abstract class implements two main abstract methods:
run(self, target: str, kubecli: KrknTelemetryOpenshift, error_queue: queue.Queue = None) is the entrypoint for each Network Chaos module.
If the module is configured to be run in parallel error_queue must not be None
target: param is the name of the resource (Pod, Node etc.) that will be targeted by the scenario
kubecli: the KrknTelemetryOpenshift needed by the scenario to access to the krkn-lib methods
error_queue: a queue that will be used by the plugin to push the errors raised during the execution of parallel modules
get_config(self) -> (NetworkChaosScenarioType, BaseNetworkChaosConfig) returns the common subset of settings shared by all the scenarios BaseNetworkChaosConfig and the type of Network Chaos Scenario that is running (Pod Scenario or Node Scenario)
BaseNetworkChaosConfig base module configuration
Is the base class that contains the common parameters shared by all the Network Chaos NG modules.
id is the string name of the Network Chaos NG module
wait_duration if there is more than one network module config in the same config file, the plugin will wait wait_duration seconds before running the following one
test_duration the duration in seconds of the scenario
label_selector the selector used to target the resource
instance_count if greater than 0 picks instance_count elements from the targets selected by the filters randomly
execution if more than one target are selected by the selector the scenario can target the resources both in serial or parallel.
namespace the namespace were the scenario workloads will be deployed
taints : List of taints for which tolerations need to created. Example: [“node-role.kubernetes.io/master:NoSchedule”]
11.13.2 - Node Network Filter
Creates iptables rules on one or more nodes to block incoming and outgoing traffic on a port in the node network interface. Can be used to block network based services connected to the node or to block inter-node communication.
How to Run Node Network Filter Scenarios
Choose your preferred method to run node network filter scenarios:
- id:node_network_filterwait_duration:300test_duration:100label_selector:"kubernetes.io/hostname=ip-10-0-39-182.us-east-2.compute.internal"instance_count:1execution:parallelnamespace:'default'# scenario specific settingsingress:falseegress:truetarget:node-nameinterfaces:[]protocols:- tcpports:- 2049taints:[]
for the common module settings please refer to the documentation.
ingress: filters the incoming traffic on one or more ports. If set one or more network interfaces must be specified
egress : filters the outgoing traffic on one or more ports.
target: the node name (if label_selector not set)
interfaces: a list of network interfaces where the incoming traffic will be filtered
ports: the list of ports that will be filtered
protocols: the ip protocols to filter (tcp and udp)
taints : List of taints for which tolerations need to created. Example: [“node-role.kubernetes.io/master:NoSchedule”]
Usage
To enable hog scenarios edit the kraken config file, go to the section kraken -> chaos_scenarios of the yaml structure
and add a new element to the list named network_chaos_ng_scenarios then add the desired scenario
pointing to the hog.yaml file.
You can also combine multiple different scenario types in the same config.yaml file. Scenario types can be specified in any order, and you can include the same scenario type multiple times:
kraken:chaos_scenarios:- network_chaos_ng_scenarios:- scenarios/kube/node-network-filter.yml- pod_disruption_scenarios:- scenarios/pod-kill.yaml- node_scenarios:- scenarios/node-reboot.yaml- network_chaos_ng_scenarios:# Same type can appear multiple times- scenarios/kube/node-network-filter-2.yml
Examples
Please refer to the use cases section for some real usage scenarios.
Run
python run_kraken.py --config config/config.yaml
Run
$ podman run --name=<container_name> --net=host --pull=always --env-host=true -v <path-to-kube-config>:/home/krkn/.kube/config:Z -d quay.io/krkn-chaos/krkn-hub:node-network-filter
$ podman logs -f <container_name or container_id> # Streams Kraken logs$ podman inspect <container-name or container-id> --format "{{.State.ExitCode}}"# Outputs exit code which can considered as pass/fail for the scenario
$ docker run $(./get_docker_params.sh) --name=<container_name> --net=host --pull=always -v <path-to-kube-config>:/home/krkn/.kube/config:Z -d quay.io/krkn-chaos/krkn-hub:node-network-filter
OR
$ docker run -e <VARIABLE>=<value> --net=host --pull=always -v <path-to-kube-config>:/home/krkn/.kube/config:Z -d quay.io/krkn-chaos/krkn-hub:node-network-filter
$ docker logs -f <container_name or container_id> # Streams Kraken logs$ docker inspect <container-name or container-id> --format "{{.State.ExitCode}}"# Outputs exit code which can considered as pass/fail for the scenario
TIP: Because the container runs with a non-root user, ensure the kube config is globally readable before mounting it in the container. You can achieve this with the following commands:
The following environment variables can be set on the host running the container to tweak the scenario/faults being injected:
ex.)
export <parameter_name>=<value>
See list of variables that apply to all scenarios here that can be used/set in addition to these scenario specific variables
Parameter
Description
Default
TOTAL_CHAOS_DURATION
set chaos duration (in sec) as desired
60
NODE_SELECTOR
defines the node selector for choosing target nodes. If not specified, one schedulable node in the cluster will be chosen at random. If multiple nodes match the selector, all of them will be subjected to stress.
“node-role.kubernetes.io/worker=”
NODE_NAME
the node name to target (if label selector not selected
INSTANCE_COUNT
restricts the number of selected nodes by the selector
“1”
EXECUTION
sets the execution mode of the scenario on multiple nodes, can be parallel or serial
“parallel”
INGRESS
sets the network filter on incoming traffic, can be true or false
false
EGRESS
sets the network filter on outgoing traffic, can be true or false
true
INTERFACES
a list of comma separated names of network interfaces (eg. eth0 or eth0,eth1,eth2) to filter for outgoing traffic
""
PORTS
a list of comma separated port numbers (eg 8080 or 8080,8081,8082) to filter for both outgoing and incoming traffic
""
PROTOCOLS
a list of comma separated protocols to filter (tcp, udp or both)
TAINTS
List of taints for which tolerations need to created. Example: [“node-role.kubernetes.io/master:NoSchedule”]
[]
NOTE In case of using custom metrics profile or alerts profile when CAPTURE_METRICS or ENABLE_ALERTS is enabled, mount the metrics profile from the host on which the container is run using podman/docker under /home/krkn/kraken/config/metrics-aggregated.yaml and /home/krkn/kraken/config/alerts. For example:
Network interfaces to filter outgoing traffic (if more than one separated by comma)
false
--ports
string
Network ports to filter traffic (if more than one separated by comma)
true
--image
string
The network chaos injection workload container image
false
quay.io/krkn-chaos/krkn-network-chaos:latest
--protocols
string
The network protocols that will be filtered
false
tcp
--taints
String
List of taints for which tolerations need to created
false
11.13.3 - Pod Network Filter
Creates iptables rules on one or more pods to block incoming and outgoing traffic on a port in the pod network interface. Can be used to block network based services connected to the pod or to block inter-pod communication.
How to Run Pod Network Filter Scenarios
Choose your preferred method to run pod network filter scenarios:
- id:pod_network_filterwait_duration:300test_duration:100label_selector:"app=label"instance_count:1execution:parallelnamespace:'default'# scenario specific settingsingress:falseegress:truetarget:'pod-name'interfaces:[]protocols:- tcpports:- 80taints:[]
for the common module settings please refer to the documentation.
ingress: filters the incoming traffic on one or more ports. If set one or more network interfaces must be specified
egress : filters the outgoing traffic on one or more ports.
target: the pod name (if label_selector not set)
interfaces: a list of network interfaces where the incoming traffic will be filtered
ports: the list of ports that will be filtered
protocols: the ip protocols to filter (tcp and udp)
taints : List of taints for which tolerations need to created. Example: [“node-role.kubernetes.io/master:NoSchedule”]
Usage
To enable hog scenarios edit the kraken config file, go to the section kraken -> chaos_scenarios of the yaml structure
and add a new element to the list named network_chaos_ng_scenarios then add the desired scenario
pointing to the hog.yaml file.
You can also combine multiple different scenario types in the same config.yaml file. Scenario types can be specified in any order, and you can include the same scenario type multiple times:
kraken:chaos_scenarios:- network_chaos_ng_scenarios:- scenarios/kube/pod-network-filter.yml- pod_disruption_scenarios:- scenarios/pod-kill.yaml- node_scenarios:- scenarios/node-reboot.yaml- network_chaos_ng_scenarios:# Same type can appear multiple times- scenarios/kube/pod-network-filter-2.yml
Examples
Please refer to the use cases section for some real usage scenarios.
Run
python run_kraken.py --config config/config.yaml
Run
$ podman run --name=<container_name> --net=host --pull=always --env-host=true -v <path-to-kube-config>:/home/krkn/.kube/config:z -d quay.io/krkn-chaos/krkn-hub:pod-network-filter
$ podman logs -f <container_name or container_id> # Streams Kraken logs$ podman inspect <container-name or container-id> --format "{{.State.ExitCode}}"# Outputs exit code which can considered as pass/fail for the scenario
$ docker run $(./get_docker_params.sh) --name=<container_name> --net=host --pull=always -v <path-to-kube-config>:/home/krkn/.kube/config:z -d quay.io/krkn-chaos/krkn-hub:pod-network-filter
OR
$ docker run -e <VARIABLE>=<value> --net=host --pull=always -v <path-to-kube-config>:/home/krkn/.kube/config:z -d quay.io/krkn-chaos/krkn-hub:pod-network-filter
$ docker logs -f <container_name or container_id> # Streams Kraken logs$ docker inspect <container-name or container-id> --format "{{.State.ExitCode}}"# Outputs exit code which can considered as pass/fail for the scenario
TIP: Because the container runs with a non-root user, ensure the kube config is globally readable before mounting it in the container. You can achieve this with the following commands:
The following environment variables can be set on the host running the container to tweak the scenario/faults being injected:
ex.)
export <parameter_name>=<value>
See list of variables that apply to all scenarios here that can be used/set in addition to these scenario specific variables
Parameter
Description
Default
TOTAL_CHAOS_DURATION
set chaos duration (in sec) as desired
60
POD_SELECTOR
defines the pod selector for choosing target pods. If multiple pods match the selector, all of them will be subjected to stress.
“app=selector”
POD_NAME
the pod name to target (if POD_SELECTOR not specified)
INSTANCE_COUNT
restricts the number of selected pods by the selector
“1”
EXECUTION
sets the execution mode of the scenario on multiple pods, can be parallel or serial
“parallel”
INGRESS
sets the network filter on incoming traffic, can be true or false
false
EGRESS
sets the network filter on outgoing traffic, can be true or false
true
INTERFACES
a list of comma separated names of network interfaces (eg. eth0 or eth0,eth1,eth2) to filter for outgoing traffic
""
PORTS
a list of comma separated port numbers (eg 8080 or 8080,8081,8082) to filter for both outgoing and incoming traffic
""
PROTOCOLS
a list of comma separated network protocols (tcp, udp or both of them e.g. tcp,udp)
“tcp”
TAINTS
List of taints for which tolerations need to created. Example: [“node-role.kubernetes.io/master:NoSchedule”]
[]
NOTE In case of using custom metrics profile or alerts profile when CAPTURE_METRICS or ENABLE_ALERTS is enabled, mount the metrics profile from the host on which the container is run using podman/docker under /home/krkn/kraken/config/metrics-aggregated.yaml and /home/krkn/kraken/config/alerts. For example:
Network interfaces to filter outgoing traffic (if more than one separated by comma)
false
--ports
string
Network ports to filter traffic (if more than one separated by comma)
true
--image
string
The network chaos injection workload container image
false
quay.io/krkn-chaos/krkn-network-chaos:latest
--protocols
string
The network protocols that will be filtered
false
tcp
--taints
String
List of taints for which tolerations need to created
false
11.14 - Network Chaos Scenario
Scenario to introduce network latency, packet loss, and bandwidth restriction in the Node's host network interface. The purpose of this scenario is to observe faults caused by random variations in the network.
How to Run Network Chaos Scenarios
Choose your preferred method to run network chaos scenarios:
network_chaos:# Scenario to create an outage by simulating random variations in the network.duration:300# In seconds - duration network chaos will be applied.node_name:# Comma separated node names on which scenario has to be injected.label_selector:node-role.kubernetes.io/master # When node_name is not specified, a node with matching label_selector is selected for running the scenario.instance_count:1# Number of nodes in which to execute network chaos.interfaces:# List of interface on which to apply the network restriction.- "ens5"# Interface name would be the Kernel host network interface name.execution:serial|parallel # Execute each of the egress options as a single scenario(parallel) or as separate scenario(serial).egress:latency:500msloss:50% # percentagebandwidth:10mbitimage:quay.io/krkn-chaos/krkn:tools
Sample scenario config for ingress traffic shaping (using a plugin)
- id:network_chaosconfig:node_interface_name:# Dictionary with key as node name(s) and value as a list of its interfaces to testip-10-0-128-153.us-west-2.compute.internal:- ens5- genev_sys_6081label_selector:node-role.kubernetes.io/master # When node_interface_name is not specified, nodes with matching label_selector is selected for node chaos scenario injectioninstance_count:1# Number of nodes to perform action/select that match the label selectorkubeconfig_path:~/.kube/config # Path to kubernetes config file. If not specified, it defaults to ~/.kube/configexecution_type:parallel # Execute each of the ingress options as a single scenario(parallel) or as separate scenario(serial).network_params:latency:500msloss:'50%'bandwidth:10mbitwait_duration:120test_duration:60image:quay.io/krkn-chaos/krkn:tools
Note: For ingress traffic shaping, ensure that your node doesn’t have any IFB interfaces already present. The scenario relies on creating IFBs to do the shaping, and they are deleted at the end of the scenario.
Steps
Pick the nodes to introduce the network anomaly either from node_name or label_selector.
Verify interface list in one of the nodes or use the interface with a default route, as test interface, if no interface is specified by the user.
Set traffic shaping config on node’s interface using tc and netem.
Wait for the duration time.
Remove traffic shaping config on node’s interface.
Remove the job that spawned the pod.
How to Use Plugin Name
Add the plugin name to the list of chaos_scenarios section in the config/config.yaml file
kraken:kubeconfig_path:~/.kube/config # Path to kubeconfig..chaos_scenarios:- network_chaos_scenarios:- scenarios/<scenario_name>.yaml
Note
You can specify multiple scenario files of the same type by adding additional paths to the list:
You can also combine multiple different scenario types in the same config.yaml file. Scenario types can be specified in any order, and you can include the same scenario type multiple times:
kraken:chaos_scenarios:- network_chaos_scenarios:- scenarios/network-chaos.yaml- pod_disruption_scenarios:- scenarios/pod-kill.yaml- container_scenarios:- scenarios/container-kill.yaml- network_chaos_scenarios:# Same type can appear multiple times- scenarios/network-chaos-2.yaml
Run
python run_kraken.py --config config/config.yaml
This scenario introduces network latency, packet loss, bandwidth restriction in the egress traffic of a Node’s interface using the tc and Netem. For more information refer the following documentation.
Run
If enabling Cerberus to monitor the cluster and pass/fail the scenario post chaos, refer docs. Make sure to start it before injecting the chaos and set CERBERUS_ENABLED environment variable for the chaos injection container to autoconnect.
$ podman run \
--name=<container_name> \
--net=host \
--pull=always \
--env-host=true\
-v <path-to-kube-config>:/home/krkn/.kube/config:Z \
-d containers.krkn-chaos.dev/krkn-chaos/krkn-hub:network-chaos
$ podman logs -f <container_name or container_id> # Streams Kraken logs$ podman inspect <container-name or container-id> \
--format "{{.State.ExitCode}}"# Outputs exit code which can considered as pass/fail for the scenario
Note
–env-host: This option is not available with the remote Podman client, including Mac and Windows (excluding WSL2) machines.
Without the –env-host option you’ll have to set each environment variable on the podman command line like -e <VARIABLE>=<value>
$ docker run \
-e <VARIABLE>=<value> \
--net=host \
--pull=always \
-v <path-to-kube-config>:/home/krkn/.kube/config:Z \
-d containers.krkn-chaos.dev/krkn-chaos/krkn-hub:network-chaos
$ docker logs -f <container_name or container_id> # Streams Kraken logs$ docker inspect <container-name or container-id> \
--format "{{.State.ExitCode}}"# Outputs exit code which can considered as pass/fail for the scenario
Tip
Because the container runs with a non-root user, ensure the kube config is globally readable before mounting it in the container. You can achieve this with the following commands:
kubectl config view --flatten > ~/kubeconfig && chmod 444 ~/kubeconfig && docker run $(./get_docker_params.sh) --name=<container_name> --net=host --pull=always -v ~kubeconfig:/home/krkn/.kube/config:Z -d containers.krkn-chaos.dev/krkn-chaos/krkn-hub:<scenario>
Supported parameters
The following environment variables can be set on the host running the container to tweak the scenario/faults being injected:
Example if –env-host is used:
export <parameter_name>=<value>
OR on the command line like example:
-e <VARIABLE>=<value>
Note
export TRAFFIC_TYPE=egress for Egress scenarios and export TRAFFIC_TYPE=ingress for Ingress scenarios
See list of variables that apply to all scenarios here that can be used/set in addition to these scenario specific variables
Egress Scenarios
Parameter
Description
Default
DURATION
Duration in seconds - during with network chaos will be applied.
300
IMAGE
Image used to disrupt network on a pod
quay.io/krkn-chaos/krkn:tools
NODE_NAME
Node name to inject faults in case of targeting a specific node; Can set multiple node names separated by a comma
""
LABEL_SELECTOR
When NODE_NAME is not specified, a node with matching label_selector is selected for running.
node-role.kubernetes.io/master
INSTANCE_COUNT
Targeted instance count matching the label selector
1
INTERFACES
List of interface on which to apply the network restriction.
[]
EXECUTION
Execute each of the egress option as a single scenario(parallel) or as separate scenario(serial).
parallel
EGRESS
Dictonary of values to set network latency(latency: 50ms), packet loss(loss: 0.02), bandwidth restriction(bandwidth: 100mbit)
{bandwidth: 100mbit}
Ingress Scenarios
Parameter
Description
Default
DURATION
Duration in seconds - during with network chaos will be applied.
300
IMAGE
Image used to disrupt network on a pod
quay.io/krkn-chaos/krkn:tools
TARGET_NODE_AND_INTERFACE
# Dictionary with key as node name(s) and value as a list of its interfaces to test. For example: {ip-10-0-216-2.us-west-2.compute.internal: [ens5]}
""
LABEL_SELECTOR
When NODE_NAME is not specified, a node with matching label_selector is selected for running.
node-role.kubernetes.io/master
INSTANCE_COUNT
Targeted instance count matching the label selector
1
EXECUTION
Used to specify whether you want to apply filters on interfaces one at a time or all at once.
parallel
NETWORK_PARAMS
latency, loss and bandwidth are the three supported network parameters to alter for the chaos test. For example: {latency: 50ms, loss: ‘0.02’}
""
WAIT_DURATION
Ensure that it is at least about twice of test_duration
300
Note
For disconnected clusters, be sure to also mirror the helper image of quay.io/krkn-chaos/krkn:tools and set the mirrored image path properly
Note
In case of using custom metrics profile or alerts profile when CAPTURE_METRICS or ENABLE_ALERTS is enabled, mount the metrics profile from the host on which the container is run using podman/docker under /home/krkn/kraken/config/metrics-aggregated.yaml and /home/krkn/kraken/config/alerts.
Selects the network chaos scenario type can be ingress or egress
enum
ingress
--image
Image used to disrupt network on a pod
string
quay.io/krkn-chaos/krkn:tools
--duration
Duration in seconds - during with network chaos will be applied.
number
300
--label-selector
When NODE_NAME is not specified, a node with matching label_selector is selected for running.
string
node-role.kubernetes.io/master
--execution
Execute each of the egress option as a single scenario(parallel) or as separate scenario(serial).
enum
parallel
--instance-count
Targeted instance count matching the label selector.
number
1
--node-name
Node name to inject faults in case of targeting a specific node; Can set multiple node names separated by a comma
string
--interfaces
List of interface on which to apply the network restriction. eg.
[eth0,eth1,eth2]
string
--egress
Dictonary of values to set network latency(latency: 50ms), packet loss(loss: 0.02), bandwidth restriction(bandwidth: 100mbit) eg. {bandwidth: 100mbit}
string
“{bandwidth: 100mbit}”
--target-node-interface
Dictionary with key as node name(s) and value as a list of its interfaces to test. For example: {ip-10-0-216-2.us-west-2.compute.internal: ens5]}
string
--network-params
latency, loss and bandwidth are the three supported network parameters to alter for the chaos test. For example: {latency: 50ms, loss: 0.02}
string
--wait-duration
Ensure that it is at least about twice of test_duration
number
300
To see all available scenario options
krknctl run network-chaos --help
11.15 - Node Scenarios
This scenario disrupts the node(s) matching the label or node name(s) on a Kubernetes/OpenShift cluster. These scenarios are performed in two different ways, either by the clusters cloud cli or by common/generic commands that can be performed on any cluster.
Actions
The following node chaos scenarios are supported:
node_start_scenario: Scenario to start the node instance. Need access to cloud provider
node_stop_scenario: Scenario to stop the node instance. Need access to cloud provider
node_stop_start_scenario: Scenario to stop and then start the node instance. Not supported on VMware. Need access to cloud provider
node_termination_scenario: Scenario to terminate the node instance. Need access to cloud provider
node_reboot_scenario: Scenario to reboot the node instance. Need access to cloud provider
stop_kubelet_scenario: Scenario to stop the kubelet of the node instance. Need access to cloud provider
stop_start_kubelet_scenario: Scenario to stop and start the kubelet of the node instance. Need access to cloud provider
restart_kubelet_scenario: Scenario to restart the kubelet of the node instance. Can be used with generic cloud type or when you don’t have access to cloud provider
node_crash_scenario: Scenario to crash the node instance. Can be used with generic cloud type or when you don’t have access to cloud provider
stop_start_helper_node_scenario: Scenario to stop and start the helper node and check service status. Need access to cloud provider
node_block_scenario: Scenario to block inbound and outbound traffic from other nodes to a specific node for a set duration (only for Azure). Need access to cloud provider
node_disk_detach_attach_scenario: Scenario to detach and reattach disks (only for baremetals).
If the node does not recover from the node_crash_scenario injection, reboot the node to get it back to Ready state.
Note
node_start_scenario, node_stop_scenario, node_stop_start_scenario, node_termination_scenario, node_reboot_scenario and stop_start_kubelet_scenario are supported on
AWS
Azure
OpenStack
BareMetal
GCP
VMware
Alibaba
IbmCloud
IbmCloudPower
Recovery Times
In each node scenario, the end telemetry details of the run will show the time it took for each node to stop and recover depening on the scenario.
The details printed in telemetry:
node_name: Node name
node_id: Node id
not_ready_time: Amount of time the node took to get to a not ready state after cloud provider has stopped node
ready_time: Amount of time the node took to get to a ready state after cloud provider has become in started state
stopped_time: Amount of time the cloud provider took to stop a node
running_time: Amount of time the cloud provider took to get a node running
terminating_time: Amount of time the cloud provider took for node to become terminated
You can also combine multiple different scenario types in the same config.yaml file. Scenario types can be specified in any order, and you can include the same scenario type multiple times:
kraken:chaos_scenarios:- node_scenarios:- scenarios/node-reboot.yaml- pod_disruption_scenarios:- scenarios/pod-kill.yaml- container_scenarios:- scenarios/container-kill.yaml- node_scenarios:# Same type can appear multiple times- scenarios/node-stop-start.yaml
Sample scenario file, you are able to specify multiple list items under node_scenarios that will be ran serially
node_scenarios:- actions:# node chaos scenarios to be injected- <action> # Can specify multiple actions herenode_name:<node_name> # node on which scenario has to be injected; can set multiple names separated by commalabel_selector:<label> # when node_name is not specified, a node with matching label_selector is selected for node chaos scenario injection; can specify multiple by a comma separated listexclude_label:<label> # if label_selector is set, will exclude nodes marked by this label from the chaos scenarioinstance_count:<instance_number># Number of nodes to perform action/select that match the label selectorruns:<run_int> # number of times to inject each scenario under actions (will perform on same node each time)timeout:<timeout> # duration to wait for completion of node scenario injectionduration:<duration> # duration to stop the node before running the start actioncloud_type:<cloud> # cloud type on which Kubernetes/OpenShift runs parallel:<true_or_false> # Run action on label or node name in parallel or sequential, defaults to sequentialkube_check:<true_or_false># Run the kubernetes api calls to see if the node gets to a certain state during the node scenariodisable_ssl_verification:<true_or_false># Disable SSL verification, to avoid certificate errors
AWS
Cloud setup instructions can be found here.
Sample scenario config can be found here.
The cloud type in the scenario yaml file needs to be aws
The cloud type in the scenario yaml file needs to be bm
Note
Baremetal requires setting the IPMI user and password to power on, off, and reboot nodes, using the config options bm_user and bm_password. It can either be set in the root of the entry in the scenarios config, or it can be set per machine.
If no per-machine addresses are specified, kraken attempts to use the BMC value in the BareMetalHost object. To list them, you can do ‘oc get bmh -o wide –all-namespaces’. If the BMC values are blank, you must specify them per-machine using the config option ‘bmc_addr’ as specified below.
For per-machine settings, add a “bmc_info” section to the entry in the scenarios config. Inside there, add a configuration section using the node name. In that, add per-machine settings. Valid settings are ‘bmc_user’, ‘bmc_password’, ‘bmc_addr’ and ‘disks’.
See the example node scenario or the example below.
Note
Baremetal requires oc (openshift client) be installed on the machine running Kraken.
Note
Baremetal machines are fragile. Some node actions can occasionally corrupt the filesystem if it does not shut down properly, and sometimes the kubelet does not start properly.
Docker
The Docker provider can be used to run node scenarios against kind clusters.
kind is a tool for running local Kubernetes clusters using Docker container “nodes”.
kind was primarily designed for testing Kubernetes itself, but may be used for local development or CI.
GCP
Cloud setup instructions can be found here. Sample scenario config can be found here.
The cloud type in the scenario yaml file needs to be gcp
Openstack
How to set up Openstack cli to run node scenarios is defined here.
The cloud type in the scenario yaml file needs to be openstack
The supported node level chaos scenarios on an OPENSTACK cloud are only: node_stop_start_scenario, stop_start_kubelet_scenario and node_reboot_scenario.
Note
For stop_start_helper_node_scenario, visit here to learn more about the helper node and its usage.
To execute the scenario, ensure the value for ssh_private_key in the node scenarios config file is set with the correct private key file path for ssh connection to the helper node. Ensure passwordless ssh is configured on the host running Kraken and the helper node to avoid connection errors.
Azure
Cloud setup instructions can be found here. Sample scenario config can be found here.
The cloud type in the scenario yaml file needs to be azure
Alibaba
How to set up Alibaba cli to run node scenarios is defined here.
Note
There is no “terminating” idea in Alibaba, so any scenario with terminating will “release” the node
. Releasing a node is 2 steps, stopping the node and then releasing it.
The cloud type in the scenario yaml file needs to be alibaba
VMware
How to set up VMware vSphere to run node scenarios is defined here
The cloud type in the scenario yaml file needs to be vmware
IBMCloud
How to set up IBMCloud to run node scenarios is defined here
The cloud type in the scenario yaml file needs to be ibmpower or ibmcloudpower
General
Note
The node_crash_scenario and stop_kubelet_scenario scenarios are supported independent of the cloud platform.
Use ‘generic’ or do not add the ‘cloud_type’ key to your scenario if your cluster is not set up using one of the current supported cloud types.
Run
python run_kraken.py --config config/config.yaml
This scenario disrupts the node(s) matching the label on a Kubernetes/OpenShift cluster. Actions/disruptions supported are listed here
Run
If enabling Cerberus to monitor the cluster and pass/fail the scenario post chaos, refer docs. Make sure to start it before injecting the chaos and set CERBERUS_ENABLED environment variable for the chaos injection container to autoconnect.
$ podman run \
--name=<container_name> \
--net=host \
--env-host=true\
-v <path-to-kube-config>:/home/krkn/.kube/config:Z \
-d containers.krkn-chaos.dev/krkn-chaos/krkn-hub:node-scenarios
$ podman logs -f <container_name or container_id> # Streams Kraken logs$ podman inspect <container-name or container-id> \
--format "{{.State.ExitCode}}"# Outputs exit code which can considered as pass/fail for the scenario
Note
–env-host: This option is not available with the remote Podman client, including Mac and Windows (excluding WSL2) machines.
Without the –env-host option you’ll have to set each environment variable on the podman command line like -e <VARIABLE>=<value>
$ docker run $(./get_docker_params.sh)\
--name=<container_name> \
--net=host \
-v <path-to-kube-config>:/home/krkn/.kube/config:Z \
-d containers.krkn-chaos.dev/krkn-chaos/krkn-hub:node-scenarios
$ docker run \
-e <VARIABLE>=<value> \
--net=host \
-v <path-to-kube-config>:/home/krkn/.kube/config:Z \
-d containers.krkn-chaos.dev/krkn-chaos/krkn-hub:node-scenarios
$ docker logs -f <container_name or container_id> # Streams Kraken logs$ docker inspect <container-name or container-id> \
--format "{{.State.ExitCode}}"# Outputs exit code which can considered as pass/fail for the scenario
Tip
Because the container runs with a non-root user, ensure the kube config is globally readable before mounting it in the container. You can achieve this with the following commands:
Nodes labeled with this value will be excluded from the chaos
NODE_NAME
Node name to inject faults in case of targeting a specific node; Can set multiple node names separated by a comma
""
INSTANCE_COUNT
Targeted instance count matching the label selector
1
RUNS
Iterations to perform action on a single node
1
CLOUD_TYPE
Cloud platform on top of which cluster is running, supported platforms - aws, vmware, ibmcloud, ibmcloudpower, bm
aws
TIMEOUT
Duration to wait for completion of node scenario injection
180
DURATION
Duration to stop the node before running the start action - not supported for vmware and ibm cloud type
120
KUBE_CHECK
Connect to the kubernetes api to see if the node gets to a certain state during the node scenario
False
PARALLEL
Run action on label or node name in parallel or sequential, set to true for parallel
False
DISABLE_SSL_VERIFICATION
Disable SSL verification, to avoid certificate errors
False
BMC_USER
Only needed for Baremetal ( bm ) - IPMI/bmc username
""
BMC_PASSWORD
Only needed for Baremetal ( bm ) - IPMI/bmc password
""
BMC_ADDR
Only needed for Baremetal ( bm ) - IPMI/bmc username
""
Note
In case of using custom metrics profile or alerts profile when CAPTURE_METRICS or ENABLE_ALERTS is enabled, mount the metrics profile from the host on which the container is run using podman/docker under /home/krkn/kraken/config/metrics-aggregated.yaml and /home/krkn/kraken/config/alerts.
Node name to inject faults in case of targeting a specific node; Can set multiple node names separated by a comma
string
--instance-count
Targeted instance count matching the label selector
number
1
--runs
Iterations to perform action on a single node
number
1
--cloud-type
Cloud platform on top of which cluster is running, supported platforms - aws, azure, gcp, vmware, ibmcloud, bm
enum
aws
--kube-check
Connecting to the kubernetes api to check the node status, set to False for SNO
enum
true
--timeout
Duration to wait for completion of node scenario injection
number
180
--duration
Duration to wait for completion of node scenario injection
number
120
--vsphere-ip
VSpere IP Address
string
--vsphere-username
VSpere IP Address
string (secret)
--vsphere-password
VSpere password
string (secret)
--aws-access-key-id
AWS Access Key Id
string (secret)
--aws-secret-access-key
AWS Secret Access Key
string (secret)
--aws-default-region
AWS default region
string
--bmc-user
Only needed for Baremetal ( bm ) - IPMI/bmc username
string(secret)
--bmc-password
Only needed for Baremetal ( bm ) - IPMI/bmc password
string(secret)
--bmc-address
Only needed for Baremetal ( bm ) - IPMI/bmc address
string
--ibmc-address
IBM Cloud URL
string
--ibmc-api-key
IBM Cloud API Key
string (secret)
--ibmc-power-address
IBM Power Cloud URL
string
--ibmc-cnr
IBM Cloud Power Workspace CNR
string
--disable-ssl-verification
Disable SSL verification, to avoid certificate errors
enum
false
--azure-tenant
Azure Tenant
string
--azure-client-secret
Azure Client Secret
string(secret)
--azure-client-id
Azure Client ID
string(secret)
--azure-subscription-id
Azure Subscription ID
string (secret)
--gcp-application-credentials
GCP application credentials file location
file
NOTE: The secret string types will be masked when scenario is ran
To see all available scenario options
krknctl run node-scenarios --help
Demo
See a demo of this scenario:
11.15.1 - Node Scenarios on Bare Metal using Krkn-Hub
Node Scenarios Bare Metal
This scenario disrupts the node(s) matching the label on a bare metal Kubernetes/OpenShift cluster. Actions/disruptions supported are listed here
Run
Unlike other krkn-hub scenarios, this one requires a specific configuration due to its unique structure.
You must set up the scenario in a local file following the scenario syntax, and then pass this file’s base64-encoded content to the container via the SCENARIO_BASE64 variable.
If enabling Cerberus to monitor the cluster and pass/fail the scenario post chaos, refer docs. Make sure to start it before injecting the chaos and set CERBERUS_ENABLED environment variable for the chaos injection container to autoconnect.
$ podman run --name=<container_name> --net=host --pull=always \
-env-host=true\
-e SCENARIO_BASE64="$(base64 -w0 <scenario_file>)"\
-v <path-to-kube-config>:/home/krkn/.kube/config:Z -d quay.io/krkn-chaos/krkn-hub:node-scenarios-bm
$ podman logs -f <container_name or container_id> # Streams Kraken logs$ podman inspect <container-name or container-id> \
--format "{{.State.ExitCode}}"# Outputs exit code which can considered as pass/fail for the scenario
$ docker run $(./get_docker_params.sh) --name=<container_name> --net=host --pull=always \
-e SCENARIO_BASE64="$(base64 -w0 <scenario_file>)"\
-v <path-to-kube-config>:/home/krkn/.kube/config:Z -d quay.io/krkn-chaos/krkn-hub:node-scenarios-bm
OR
$ docker run \
-e SCENARIO_BASE64="$(base64 -w0 <scenario_file>)"\
--net=host --pull=always -v <path-to-kube-config>:/home/krkn/.kube/config:Z -d quay.io/krkn-chaos/krkn-hub:node-scenarios-bm
$ docker logs -f <container_name or container_id> # Streams Kraken logs$ docker inspect <container-name or container-id> \
--format "{{.State.ExitCode}}"# Outputs exit code which can considered as pass/fail for the scenario
TIP: Because the container runs with a non-root user, ensure the kube config is globally readable before mounting it in the container. You can achieve this with the following commands:
kubectl config view --flatten > ~/kubeconfig && chmod 444 ~/kubeconfig && docker run $(./get_docker_params.sh) --name=<container_name> --net=host --pull=always -v ~kubeconfig:/home/krkn/.kube/config:Z -d quay.io/krkn-chaos/krkn-hub:<scenario>
Supported parameters
See list of variables that apply to all scenarios here that can be used/set in addition to these scenario specific variables
Demo
See a demo of this scenario:
NOTE In case of using custom metrics profile or alerts profile when CAPTURE_METRICS or ENABLE_ALERTS is enabled, mount the metrics profile from the host on which the container is run using podman/docker under /home/krkn/kraken/config/metrics-aggregated.yaml and /home/krkn/kraken/config/alerts. For example:
11.16 - Pod Network Scenarios
Pod outage
Scenario to block the traffic (Ingress/Egress) of a pod matching the labels for the specified duration of time to understand the behavior of the service/other services which depend on it during downtime. This helps with planning the requirements accordingly, be it improving the timeouts or tweaking the alerts etc.
With the current network policies, it is not possible to explicitly block ports which are enabled by allowed network policy rule. This chaos scenario addresses this issue by using OVS flow rules to block ports related to the pod. It supports OpenShiftSDN and OVNKubernetes based networks.
Excluding Pods from Network Outage
The pod outage scenario now supports excluding specific pods from chaos testing using the exclude_label parameter. This allows you to target a namespace or group of pods with your chaos testing while deliberately preserving certain critical workloads.
Why Use Pod Exclusion?
This feature addresses several common use cases:
Testing resiliency of an application while keeping critical monitoring pods operational
Preserving designated “control plane” pods within a microservice architecture
Allowing targeted chaos without affecting auxiliary services in the same namespace
Enabling more precise pod selection when network policies require all related services to be in the same namespace
How to Use the exclude_label Parameter
The exclude_label parameter works alongside existing pod selection parameters (label_selector and pod_name). The system will:
Identify all pods in the target namespace
Exclude pods matching the exclude_label criteria (in format “key=value”)
Apply the existing filters (label_selector or pod_name)
Apply the chaos scenario to the resulting pod list
In this example, network disruption is applied to all pods with the label app=my-service in the my-application namespace, except for those that also have the label critical=true.
This scenario blocks ingress traffic on port 8443 for pods matching component=ui label in the openshift-console namespace, but will skip any pods labeled with excluded=true.
The exclude_label parameter is also supported in the pod network shaping scenarios (pod_egress_shaping and pod_ingress_shaping), allowing for the same selective application of network latency, packet loss, and bandwidth restriction.
How to Run Pod Network Scenarios
Choose your preferred method to run pod network scenarios:
- id:pod_network_outageconfig:namespace:openshift-console # Required - Namespace of the pod to which filter need to be applieddirection:# Optional - List of directions to apply filters- ingress # Blocks ingress traffic, Default both egress and ingressingress_ports:# Optional - List of ports to block traffic on- 8443# Blocks 8443, Default [], i.e. all ports.label_selector:'component=ui'# Blocks access to openshift consoleexclude_label:'critical=true'# Optional - Pods matching this label will be excluded from the chaosimage:quay.io/krkn-chaos/krkn:tools
Pod Network shaping
Scenario to introduce network latency, packet loss, and bandwidth restriction in the Pod’s network interface. The purpose of this scenario is to observe faults caused by random variations in the network.
Sample scenario config for egress traffic shaping (using plugin)
- id:pod_egress_shapingconfig:namespace:openshift-console # Required - Namespace of the pod to which filter need to be applied.label_selector:'component=ui'# Applies traffic shaping to access openshift console.exclude_label:'critical=true'# Optional - Pods matching this label will be excluded from the chaosnetwork_params:latency:500ms # Add 500ms latency to egress traffic from the pod.image:quay.io/krkn-chaos/krkn:tools
Sample scenario config for ingress traffic shaping (using plugin)
- id:pod_ingress_shapingconfig:namespace:openshift-console # Required - Namespace of the pod to which filter need to be applied.label_selector:'component=ui'# Applies traffic shaping to access openshift console.exclude_label:'critical=true'# Optional - Pods matching this label will be excluded from the chaosnetwork_params:latency:500ms # Add 500ms latency to egress traffic from the pod.image:quay.io/krkn-chaos/krkn:tools
Steps
Pick the pods to introduce the network anomaly either from label_selector or pod_name.
Identify the pod interface name on the node.
Set traffic shaping config on pod’s interface using tc and netem.
Wait for the duration time.
Remove traffic shaping config on pod’s interface.
Remove the job that spawned the pod.
How to Use Plugin Name
Add the plugin name to the list of chaos_scenarios section in the config/config.yaml file
kraken:kubeconfig_path:~/.kube/config # Path to kubeconfig..chaos_scenarios:- pod_network_scenarios:- scenarios/<scenario_name>.yaml
Note
You can specify multiple scenario files of the same type by adding additional paths to the list:
You can also combine multiple different scenario types in the same config.yaml file. Scenario types can be specified in any order, and you can include the same scenario type multiple times:
kraken:chaos_scenarios:- pod_network_scenarios:- scenarios/pod-network.yaml- pod_disruption_scenarios:- scenarios/pod-kill.yaml- container_scenarios:- scenarios/container-kill.yaml- pod_network_scenarios:# Same type can appear multiple times- scenarios/pod-network-2.yaml
Run
python run_kraken.py --config config/config.yaml
This scenario runs network chaos at the pod level on a Kubernetes/OpenShift cluster.
Run
If enabling Cerberus to monitor the cluster and pass/fail the scenario post chaos, refer docs. Make sure to start it before injecting the chaos and set CERBERUS_ENABLED environment variable for the chaos injection container to autoconnect.
$ podman run \
--name=<container_name> \
--net=host \
--pull=always \
--env-host=true\
-v <path-to-kube-config>:/home/krkn/.kube/config:Z \
-d containers.krkn-chaos.dev/krkn-chaos/krkn-hub:pod-network-chaos
$ podman logs -f <container_name or container_id> # Streams Kraken logs$ podman inspect <container-name or container-id> \
--format "{{.State.ExitCode}}"# Outputs exit code which can considered as pass/fail for the scenario
Note
–env-host: This option is not available with the remote Podman client, including Mac and Windows (excluding WSL2) machines.
Without the –env-host option you’ll have to set each environment variable on the podman command line like -e <VARIABLE>=<value>
$ docker run $(./get_docker_params.sh)\
--name=<container_name> \
--net=host \
--pull=always \
-v <path-to-kube-config>:/home/krkn/.kube/config:Z \
-d containers.krkn-chaos.dev/krkn-chaos/krkn-hub:pod-network-chaos
$ docker run \
-e <VARIABLE>=<value> \
--name=<container_name> \
--net=host \
--pull=always \
-v <path-to-kube-config>:/home/krkn/.kube/config:Z \
-d containers.krkn-chaos.dev/krkn-chaos/krkn-hub:pod-network-chaos
$ docker logs -f <container_name or container_id> # Streams Kraken logs$ docker inspect <container-name or container-id> \
--format "{{.State.ExitCode}}"# Outputs exit code which can considered as pass/fail for the scenario
Tip
Because the container runs with a non-root user, ensure the kube config is globally readable before mounting it in the container. You can achieve this with the following commands:
kubectl config view --flatten > ~/kubeconfig && chmod 444 ~/kubeconfig && docker run $(./get_docker_params.sh) --name=<container_name> --net=host --pull=always -v ~kubeconfig:/home/krkn/.kube/config:Z -d containers.krkn-chaos.dev/krkn-chaos/krkn-hub:<scenario>
Supported parameters
The following environment variables can be set on the host running the container to tweak the scenario/faults being injected:
Example if –env-host is used:
export <parameter_name>=<value>
OR on the command line like example:
-e <VARIABLE>=<value>
See list of variables that apply to all scenarios here that can be used/set in addition to these scenario specific variables
Parameter
Description
Default
NAMESPACE
Required - Namespace of the pod to which filter need to be applied
""
IMAGE
Image used to disrupt network on a pod
“quay.io/krkn-chaos/krkn:tools”
LABEL_SELECTOR
Label of the pod(s) to target
""
POD_NAME
When label_selector is not specified, pod matching the name will be selected for the chaos scenario
""
EXCLUDE_LABEL
Pods matching this label will be excluded from the chaos even if they match other criteria
""
INSTANCE_COUNT
Number of pods to perform action/select that match the label selector
1
TRAFFIC_TYPE
List of directions to apply filters - egress/ingress ( needs to be a list )
[ingress, egress]
INGRESS_PORTS
Ingress ports to block ( needs to be a list )
[] i.e all ports
EGRESS_PORTS
Egress ports to block ( needs to be a list )
[] i.e all ports
WAIT_DURATION
The duration (in seconds) that the network chaos (traffic shaping, packet loss, etc.) persists on the target pods. This is the actual time window where the network disruption is active. It must be longer than TEST_DURATION to ensure the fault is active for the entire test.
300
TEST_DURATION
Duration of the test run (e.g. workload or verification)
120
Note
For disconnected clusters, be sure to also mirror the helper image of quay.io/krkn-chaos/krkn:tools and set the mirrored image path properly
Note
In case of using custom metrics profile or alerts profile when CAPTURE_METRICS or ENABLE_ALERTS is enabled, mount the metrics profile from the host on which the container is run using podman/docker under /home/krkn/kraken/config/metrics-aggregated.yaml and /home/krkn/kraken/config/alerts.
Namespace of the pod to which filter need to be applied
string
--image
Image used to disrupt network on a pod
string
quay.io/krkn-chaos/krkn:tools
--label-selector
When pod_name is not specified, pod matching the label will be selected for the chaos scenario
string
--exclude-label
Pods matching this label will be excluded from the chaos even if they match other criteria
string
""
--pod-name
When label_selector is not specified, pod matching the name will be selected for the chaos scenario
string
--instance-count
Targeted instance count matching the label selector
number
1
--traffic-type
List of directions to apply filters - egress/ingress ( needs to be a list )
string
“[ingress,egress]”
--ingress-ports
Ingress ports to block ( needs to be a list )
string
--egress-ports
Egress ports to block ( needs to be a list )
string
--wait-duration
Ensure that it is at least about twice of test_duration
number
300
--test-duration
Duration of the test run
number
120
To see all available scenario options
krknctl run pod-network-chaos --help
11.17 - Pod Scenarios
This scenario disrupts the pods matching the label, excluded label or pod name in the specified namespace on a Kubernetes/OpenShift cluster.
Why pod scenarios are important:
Modern applications demand high availability, low downtime, and resilient infrastructure. Kubernetes provides building blocks like Deployments, ReplicaSets, and Services to support fault tolerance, but understanding how these interact during disruptions is critical for ensuring reliability. Pod disruption scenarios test this reliability under various conditions, validating that the application and infrastructure respond as expected.
Use cases of pod scenarios
Deleting a single pod
Use Case: Simulates unplanned deletion of a single pod
Why It’s Important: Validates whether the ReplicaSet or Deployment automatically creates a replacement.
Customer Impact: Ensures continuous service even if a pod unexpectedly crashes.
Recovery Timing: Typically less than 10 seconds for stateless apps (seen in Krkn telemetry output).
HA Indicator: Pod is automatically rescheduled and becomes Ready without manual intervention.
kubectl delete pod <pod-name> -n <namespace>
kubectl get pods -n <namespace> -w # watch for new pods
Deleting multiple pods simultaneously
Use Case: Simulates a larger failure event, such as a node crash or AZ outage.
Why It’s Important: Tests whether the system has enough resources and policies to recover gracefully.
Customer Impact: If all pods of a service fail, user experience is directly impacted.
HA Indicator: Application can continue functioning from other replicas across zones/nodes.
Pod Eviction (Soft Disruption)
Use Case: Triggered by Kubernetes itself during node upgrades or scaling down.
Why It’s Important: Ensures graceful termination and restart elsewhere without user impact.
Customer Impact: Should be zero if readiness/liveness probes and PDBs are correctly configured.
HA Indicator: Rolling disruption does not take down the whole application.
How to know if it is highly available
Multiple Replicas Exist: Confirmed by checking kubectl get deploy -n <namespace> and seeing atleast 1 replica.
Pods Distributed Across Nodes/availability zones: Using topologySpreadConstraints or observing pod distribution in kubectl get pods -o wide. See Health Checks for real time visibility into the impact of chaos scenarios on application availability and performance
Service Uptime Remains Unaffected: During chaos test, verify app availability (synthetic probes, Prometheus alerts, etc).
Recovery Is Automatic: No manual intervention needed to restore service.
Krkn Telemetry Indicators: End of run data includes recovery times, pod reschedule latency, and service downtime which are vital metrics for assessing HA.
Excluding Pods from Disruption
Employ exclude_label to designate the safe pods in a group, while the rest of the pods in a namespace are subjected to chaos. Some frequent use cases are:
Turn off the backend pods but make sure the database replicas that are highly available remain untouched.
Inject the fault in the application layer, do not stop the infrastructure/monitoring pods.
Run a rolling disruption experiment with the control-plane or system-critical components that are not affected.
Format:
exclude_label:"key=value"
Mechanism:
Pods are selected based on namespace_pattern + label_selector or name_pattern.
Before deletion, the pods that match exclude_label are removed from the list.
Rest of the pods are subjected to chaos.
Example: Have the Leader Protected While Different etcd Replicas Are Killed
By default, pod scenarios target all pods matching the namespace and label selectors regardless of which node they run on. However, you can narrow down the scope to only affect pods running on specific nodes using two options:
Option 1: Using Node Label Selector
Target pods running on nodes with specific labels (e.g., control-plane nodes, worker nodes, nodes in a specific zone).
Format:
node_label_selector:"key=value"
Use Cases:
Test resilience of control-plane workloads by disrupting pods only on master/control-plane nodes
Simulate zone-specific failures by targeting nodes in a particular availability zone
Test worker node failures without affecting control-plane components
Pods are selected based on namespace_pattern + label_selector or name_pattern
The selection is further filtered to only include pods running on the specified nodes
If exclude_label is also specified, it’s applied after node filtering
The remaining pods are subjected to chaos
Recovery Time Metrics in Krkn Telemetry
Krkn tracks three key recovery time metrics for each affected pod:
pod_rescheduling_time - The time (in seconds) that the Kubernetes cluster took to reschedule the pod after it was killed. This measures the cluster’s scheduling efficiency and includes the time from pod deletion until the replacement pod is scheduled on a node.
pod_readiness_time - The time (in seconds) the pod took to become ready after being scheduled. This measures application startup time, including container image pulls, initialization, and readiness probe success.
total_recovery_time - The total amount of time (in seconds) from pod deletion until the replacement pod became fully ready and available to serve traffic. This is the sum of rescheduling time and readiness time.
These metrics appear in the telemetry output under PodsStatus.recovered for successfully recovered pods. Pods that fail to recover within the timeout period appear under PodsStatus.unrecovered without timing data.
You can also combine multiple different scenario types in the same config.yaml file. Scenario types can be specified in any order, and you can include the same scenario type multiple times:
kraken:chaos_scenarios:- pod_disruption_scenarios:- scenarios/pod-kill.yaml- scenarios/etcd-kill.yaml- container_scenarios:- scenarios/container-kill.yaml- node_scenarios:- scenarios/node-reboot.yaml- pod_disruption_scenarios:# Same type can appear multiple times- scenarios/pod-kill-2.yaml
You can then create the scenario file with the following contents:
# yaml-language-server: $schema=../plugin.schema.json- id:kill-podsconfig:namespace_pattern:^kube-system$label_selector:k8s-app=kube-schedulerkrkn_pod_recovery_time:120#Not needed by default, but can be used if you want to target pods on specific nodes# Option 1: Target pods on nodes with specific labels [master/worker nodes]node_label_selector:node-role.kubernetes.io/control-plane= # Target control-plane nodes (works on both k8s and openshift)exclude_label:'critical=true'# Optional - Pods matching this label will be excluded from the chaos# Option 2: Target pods of specific nodes (testing mixed node types)node_names:- ip-10-0-31-8.us-east-2.compute.internal # Worker node 1- ip-10-0-48-188.us-east-2.compute.internal # Worker node 2- ip-10-0-14-59.us-east-2.compute.internal # Master node 1
Please adjust the schema reference to point to the schema file. This file will give you code completion and documentation for the available options in your IDE.
Pod Chaos Scenarios
The following are the components of Kubernetes/OpenShift for which a basic chaos scenario config exists today.
Kills random pods running in the OpenShift system namespaces.
✔️
Run
python run_kraken.py --config config/config.yaml
This scenario disrupts the pods matching the label in the specified namespace on a Kubernetes/OpenShift cluster.
Run
If enabling Cerberus to monitor the cluster and pass/fail the scenario post chaos, refer docs. Make sure to start it before injecting the chaos and set CERBERUS_ENABLED environment variable for the chaos injection container to autoconnect.
$ podman run \
--name=<container_name> \
--net=host \
--pull=always \
--env-host=true\
-v <path-to-kube-config>:/home/krkn/.kube/config:Z \
-d containers.krkn-chaos.dev/krkn-chaos/krkn-hub:pod-scenarios
$ podman logs -f <container_name or container_id> # Streams Kraken logs$ podman inspect <container-name or container-id> \
--format "{{.State.ExitCode}}"# Outputs exit code which can considered as pass/fail for the scenario
Note
–env-host: This option is not available with the remote Podman client, including Mac and Windows (excluding WSL2) machines.
Without the –env-host option you’ll have to set each environment variable on the podman command line like -e <VARIABLE>=<value>
$ docker run $(./get_docker_params.sh)\
--name=<container_name> \
--net=host \
--pull=always \
-v <path-to-kube-config>:/home/krkn/.kube/config:Z \
-d containers.krkn-chaos.dev/krkn-chaos/krkn-hub:pod-scenarios
$ docker run \
-e <VARIABLE>=<value> \
--name=<container_name> \
--net=host \
--pull=always \
-v <path-to-kube-config>:/home/krkn/.kube/config:Z \
-d containers.krkn-chaos.dev/krkn-chaos/krkn-hub:pod-scenarios
$ docker logs -f <container_name or container_id> # Streams Kraken logs$ docker inspect <container-name or container-id> \
--format "{{.State.ExitCode}}"# Outputs exit code which can considered as pass/fail for the scenario
Tip
Because the container runs with a non-root user, ensure the kube config is globally readable before mounting it in the container. You can achieve this with the following commands:
kubectl config view --flatten > ~/kubeconfig && chmod 444 ~/kubeconfig && docker run $(./get_docker_params.sh) --name=<container_name> --net=host --pull=always -v ~kubeconfig:/home/krkn/.kube/config:Z -d containers.krkn-chaos.dev/krkn-chaos/krkn-hub:<scenario>
Supported parameters
The following environment variables can be set on the host running the container to tweak the scenario/faults being injected:
Example if –env-host is used:
export <parameter_name>=<value>
OR on the command line like example:
-e <VARIABLE>=<value>
See list of variables that apply to all scenarios here that can be used/set in addition to these scenario specific variables
Parameter
Description
Default
NAMESPACE
Targeted namespace in the cluster ( supports regex )
openshift-.*
POD_LABEL
Label of the pod(s) to target
""
EXCLUDE_LABEL
Pods matching this label will be excluded from the chaos even if they match other criteria
""
NAME_PATTERN
Regex pattern to match the pods in NAMESPACE when POD_LABEL is not specified
.*
DISRUPTION_COUNT
Number of pods to disrupt
1
KILL_TIMEOUT
Timeout to wait for the target pod(s) to be removed in seconds
180
EXPECTED_RECOVERY_TIME
Fails if the pod disrupted do not recover within the timeout set
120
NODE_LABEL_SELECTOR
Label of the node(s) to target
""
NODE_NAMES
Name of the node(s) to target. Example: [“worker-node-1”,“worker-node-2”,“master-node-1”]
[]
Note
Set NAMESPACE environment variable to openshift-.* to pick and disrupt pods randomly in openshift system namespaces, the DAEMON_MODE can also be enabled to disrupt the pods every x seconds in the background to check the reliability.
Note
In case of using custom metrics profile or alerts profile when CAPTURE_METRICS or ENABLE_ALERTS is enabled, mount the metrics profile from the host on which the container is run using podman/docker under /home/krkn/kraken/config/metrics-aggregated.yaml and /home/krkn/kraken/config/alerts.
Targeted namespace in the cluster ( supports regex )
string
openshift-*
--pod-label
Label of the pod(s) to target ex. “app=test”
string
--exclude-label
Pods matching this label will be excluded from the chaos even if they match other criteria
string
""
--name-pattern
Regex pattern to match the pods in NAMESPACE when POD_LABEL is not specified
string
.*
--disruption-count
Number of pods to disrupt
number
1
--kill-timeout
Timeout to wait for the target pod(s) to be removed in seconds
number
180
--expected-recovery-time
Fails if the pod disrupted do not recover within the timeout set
number
120
--node-label-selector
Label of the node(s) to target
string
""
--node-names
Name of the node(s) to target. Example: [“worker-node-1”,“worker-node-2”,“master-node-1”]
string
[]
To see all available scenario options
krknctl run pod-scenarios --help
Demo
See a demo of this scenario:
11.18 - Power Outage Scenarios
This scenario shuts down Kubernetes/OpenShift cluster for the specified duration to simulate power outages, brings it back online and checks if it’s healthy.
How to Run Power Outage Scenarios
Choose your preferred method to run power outage scenarios:
Power Outage/ Cluster shut down scenario can be injected by placing the shut_down config file under cluster_shut_down_scenario option in the kraken config. Refer to cluster_shut_down_scenario config file.
cluster_shut_down_scenario:# Scenario to stop all the nodes for specified duration and restart the nodes.runs:1# Number of times to execute the cluster_shut_down scenario.shut_down_duration:120# Duration in seconds to shut down the cluster.cloud_type:aws # Cloud type on which Kubernetes/OpenShift runs.
How to Use Plugin Name
Add the plugin name to the list of chaos_scenarios section in the config/config.yaml file
kraken:kubeconfig_path:~/.kube/config # Path to kubeconfig..chaos_scenarios:- cluster_shut_down_scenarios:- scenarios/<scenario_name>.yaml
Note
You can specify multiple scenario files of the same type by adding additional paths to the list:
You can also combine multiple different scenario types in the same config.yaml file. Scenario types can be specified in any order, and you can include the same scenario type multiple times:
kraken:chaos_scenarios:- cluster_shut_down_scenarios:- scenarios/power-outage.yaml- pod_disruption_scenarios:- scenarios/pod-kill.yaml- node_scenarios:- scenarios/node-reboot.yaml- cluster_shut_down_scenarios:# Same type can appear multiple times- scenarios/power-outage-2.yaml
Run
python run_kraken.py --config config/config.yaml
This scenario shuts down Kubernetes/OpenShift cluster for the specified duration to simulate power outages, brings it back online and checks if it’s healthy. More information can be found here
Right now power outage and cluster shutdown are one in the same. We originally created this scenario to stop all the nodes and then start them back up how a customer would shut their cluster down.
In a real life chaos scenario though, we figured this scenario was close to if the power went out on the aws side so all of our ec2 nodes would be stopped/powered off.
We tried to look at if aws cli had a way to forcefully poweroff the nodes (not gracefully) and they don’t currently support so this scenario is as close as we can get to “pulling the plug”
Run
If enabling Cerberus to monitor the cluster and pass/fail the scenario post chaos, refer docs. Make sure to start it before injecting the chaos and set CERBERUS_ENABLED environment variable for the chaos injection container to autoconnect.
$ podman run \
--name=<container_name> \
--net=host \
--pull=always \
--env-host=true\
-v <path-to-kube-config>:/home/krkn/.kube/config:Z \
-d containers.krkn-chaos.dev/krkn-chaos/krkn-hub:power-outages
$ podman logs -f <container_name or container_id> # Streams Kraken logs$ podman inspect <container-name or container-id> \
--format "{{.State.ExitCode}}"# Outputs exit code which can considered as pass/fail for the scenario
Note
–env-host: This option is not available with the remote Podman client, including Mac and Windows (excluding WSL2) machines.
Without the –env-host option you’ll have to set each environment variable on the podman command line like -e <VARIABLE>=<value>
$ docker run $(./get_docker_params.sh)\
--name=<container_name> \
--net=host \
--pull=always \
-v <path-to-kube-config>:/home/krkn/.kube/config:Z \
-d containers.krkn-chaos.dev/krkn-chaos/krkn-hub:power-outages
$ docker run \
-e <VARIABLE>=<value> \
--name=<container_name> \
--net=host \
--pull=always \
-v <path-to-kube-config>:/home/krkn/.kube/config:Z \
-d containers.krkn-chaos.dev/krkn-chaos/krkn-hub:power-outages
$ docker logs -f <container_name or container_id> # Streams Kraken logs$ docker inspect <container-name or container-id> \
--format "{{.State.ExitCode}}"# Outputs exit code which can considered as pass/fail for the scenario
Tip
Because the container runs with a non-root user, ensure the kube config is globally readable before mounting it in the container. You can achieve this with the following commands:
kubectl config view --flatten > ~/kubeconfig && chmod 444 ~/kubeconfig && docker run $(./get_docker_params.sh) --name=<container_name> --net=host --pull=always -v ~kubeconfig:/home/krkn/.kube/config:Z -d containers.krkn-chaos.dev/krkn-chaos/krkn-hub:<scenario>
Supported parameters
The following environment variables can be set on the host running the container to tweak the scenario/faults being injected:
example:
export <parameter_name>=<value>
See list of variables that apply to all scenarios here that can be used/set in addition to these scenario specific variables
In case of using custom metrics profile or alerts profile when CAPTURE_METRICS or ENABLE_ALERTS is enabled, mount the metrics profile from the host on which the container is run using podman/docker under /home/krkn/kraken/config/metrics-aggregated.yaml and /home/krkn/kraken/config/alerts.
Cloud platform on top of which cluster is running, supported platforms - aws, azure, gcp, vmware, ibmcloud, bm
enum
aws
--timeout
Duration to wait for completion of node scenario injection
number
180
--shutdown-duration
Duration to wait for completion of node scenario injection
number
1200
--vsphere-ip
VSpere IP Address
string
--vsphere-username
VSpere IP Address
string (secret)
--vsphere-password
VSpere password
string (secret)
--aws-access-key-id
AWS Access Key Id
string (secret)
--aws-secret-access-key
AWS Secret Access Key
string (secret)
--aws-default-region
AWS default region
string
--bmc-user
Only needed for Baremetal ( bm ) - IPMI/bmc username
string(secret)
--bmc-password
Only needed for Baremetal ( bm ) - IPMI/bmc password
string(secret)
--bmc-address
Only needed for Baremetal ( bm ) - IPMI/bmc address
string
--ibmc-address
IBM Cloud URL
string
--ibmc-api-key
IBM Cloud API Key
string (secret)
--azure-tenant
Azure Tenant
string
--azure-client-secret
Azure Client Secret
string(secret)
--azure-client-id
Azure Client ID
string(secret)
--azure-subscription-id
Azure Subscription ID
string (secret)
--gcp-application-credentials
GCP application credentials file location
file
NOTE: The secret string types will be masked when scenario is ran
To see all available scenario options
krknctl run power-outages --help
Demo
See a demo of this scenario:
11.19 - PVC Scenario
Scenario to fill up a given PersistenVolumeClaim by creating a temp file on the PVC from a pod associated with it. The purpose of this scenario is to fill up a volume to understand faults caused by the application using this volume.
How to Run PVC Scenarios
Choose your preferred method to run PVC scenarios:
pvc_scenario:
pvc_name: <pvc_name> # Name of the target PVC.
pod_name: <pod_name> # Name of the pod where the PVC is mounted. It will be ignored if the pvc_name is defined.
namespace: <namespace_name> # Namespace where the PVC is.
fill_percentage: 50 # Target percentage to fill up the cluster. Value must be higher than current percentage. Valid values are between 0 and 99.
duration: 60 # Duration in seconds for the fault.
Steps
Get the pod name where the PVC is mounted.
Get the volume name mounted in the container pod.
Get the container name where the PVC is mounted.
Get the mount path where the PVC is mounted in the pod.
Get the PVC capacity and current used capacity.
Calculate file size to fill the PVC to the target fill_percentage.
Connect to the pod.
Create a temp file kraken.tmp with random data on the mount path:
You can also combine multiple different scenario types in the same config.yaml file. Scenario types can be specified in any order, and you can include the same scenario type multiple times:
kraken:chaos_scenarios:- pvc_scenarios:- scenarios/pvc-fill.yaml- pod_disruption_scenarios:- scenarios/pod-kill.yaml- container_scenarios:- scenarios/container-kill.yaml- pvc_scenarios:# Same type can appear multiple times- scenarios/pvc-fill-2.yaml
Run
python run_kraken.py --config config/config.yaml
This scenario fills up a given PersistenVolumeClaim by creating a temp file on the PVC from a pod associated with it. The purpose of this scenario is to fill up a volume to understand faults cause by the application using this volume. For more information refer the following documentation.
Run
If enabling Cerberus to monitor the cluster and pass/fail the scenario post chaos, refer docs. Make sure to start it before injecting the chaos and set CERBERUS_ENABLED environment variable for the chaos injection container to autoconnect.
$ podman run \
--name=<container_name> \
--net=host \
--pull=always \
--env-host=true\
-v <path-to-kube-config>:/home/krkn/.kube/config:Z \
-d containers.krkn-chaos.dev/krkn-chaos/krkn-hub:pvc-scenarios
$ podman logs -f <container_name or container_id> # Streams Kraken logs$ podman inspect <container-name or container-id> \
--format "{{.State.ExitCode}}"# Outputs exit code which can considered as pass/fail for the scenario
Note
–env-host: This option is not available with the remote Podman client, including Mac and Windows (excluding WSL2) machines.
Without the –env-host option you’ll have to set each environment variable on the podman command line like -e <VARIABLE>=<value>
$ docker run $(./get_docker_params.sh)\
--name=<container_name> \
--net=host \
--pull=always \
-v <path-to-kube-config>:/home/krkn/.kube/config:Z \
-d containers.krkn-chaos.dev/krkn-chaos/krkn-hub:pvc-scenarios
$ docker run \
-e <VARIABLE>=<value> \
--name=<container_name> \
--net=host \
--pull=always \
-v <path-to-kube-config>:/home/krkn/.kube/config:Z \
-d containers.krkn-chaos.dev/krkn-chaos/krkn-hub:pvc-scenarios
$ docker logs -f <container_name or container_id> # Streams Kraken logs$ docker inspect <container-name or container-id> \
--format "{{.State.ExitCode}}"# Outputs exit code which can considered as pass/fail for the scenario
Tip
Because the container runs with a non-root user, ensure the kube config is globally readable before mounting it in the container. You can achieve this with the following commands:
kubectl config view --flatten > ~/kubeconfig && chmod 444 ~/kubeconfig && docker run $(./get_docker_params.sh) --name=<container_name> --net=host --pull=always -v ~kubeconfig:/home/krkn/.kube/config:Z -d containers.krkn-chaos.dev/krkn-chaos/krkn-hub:<scenario>
Supported parameters
The following environment variables can be set on the host running the container to tweak the scenario/faults being injected:
Example if –env-host is used:
export <parameter_name>=<value>
OR on the command line like example:
-e <VARIABLE>=<value>
If both PVC_NAME and POD_NAME are defined, POD_NAME value will be overridden from the Mounted By: value on PVC definition.
See list of variables that apply to all scenarios here that can be used/set in addition to these scenario specific variables
Parameter
Description
Default
PVC_NAME
Targeted PersistentVolumeClaim in the cluster (if null, POD_NAME is required)
POD_NAME
Targeted pod in the cluster (if null, PVC_NAME is required)
NAMESPACE
Targeted namespace in the cluster (required)
FILL_PERCENTAGE
Targeted percentage to be filled up in the PVC
50
DURATION
Duration in seconds with the PVC filled up
60
Note
Set NAMESPACE environment variable to openshift-.* to pick and disrupt pods randomly in openshift system namespaces, the DAEMON_MODE can also be enabled to disrupt the pods every x seconds in the background to check the reliability.
Note
In case of using custom metrics profile or alerts profile when CAPTURE_METRICS or ENABLE_ALERTS is enabled, mount the metrics profile from the host on which the container is run using podman/docker under /home/krkn/kraken/config/metrics-aggregated.yaml and /home/krkn/kraken/config/alerts.
Targeted PersistentVolumeClaim in the cluster (if null, POD_NAME is required)
string
--pod-name
Targeted pod in the cluster (if null, PVC_NAME is required)
string
--namespace
Targeted namespace in the cluster (required)
string
--fill-percentage
Targeted percentage to be filled up in the PVC
number
50
--duration
Duration to wait for completion of node scenario injection
number
1200
To see all available scenario options
krknctl run pvc-scenarios --help
11.20 - Service Disruption Scenarios
Using this type of scenario configuration one is able to delete crucial objects in a specific namespace, or a namespace matching a certain regex string.
How to Run Service Disruption Scenarios
Choose your preferred method to run service disruption scenarios:
namespace: Specific namespace or regex style namespace of what you want to delete. Gets all namespaces if not specified; set to "" if you want to use the label_selector field.
Set to ‘^.*$’ and label_selector to "" to randomly select any namespace in your cluster.
label_selector: Label on the namespace you want to delete. Set to "" if you are using the namespace variable.
delete_count: Number of namespaces to kill in each run. Based on matching namespace and label specified, default is 1.
runs: Number of runs/iterations to kill namespaces, default is 1.
sleep: Number of seconds to wait between each iteration/count of killing namespaces. Defaults to 10 seconds if not set
This scenario will select a namespace (or multiple) dependent on the configuration and will kill all of the below object types in that namespace and will wait for them to be Running in the post action
Services
Daemonsets
Statefulsets
Replicasets
Deployments
How to Use Plugin Name
Add the plugin name to the list of chaos_scenarios section in the config/config.yaml file
kraken:kubeconfig_path:~/.kube/config # Path to kubeconfig..chaos_scenarios:- service_disruption_scenarios:- scenarios/<scenario_name>.yaml
Note
You can specify multiple scenario files of the same type by adding additional paths to the list:
You can also combine multiple different scenario types in the same config.yaml file. Scenario types can be specified in any order, and you can include the same scenario type multiple times:
kraken:chaos_scenarios:- service_disruption_scenarios:- scenarios/service-disruption.yaml- pod_disruption_scenarios:- scenarios/pod-kill.yaml- container_scenarios:- scenarios/container-kill.yaml- service_disruption_scenarios:# Same type can appear multiple times- scenarios/service-disruption-2.yaml
Run
python run_kraken.py --config config/config.yaml
This scenario deletes main objects within a namespace in your Kubernetes/OpenShift cluster. More information can be found here.
Run
If enabling Cerberus to monitor the cluster and pass/fail the scenario post chaos, refer docs. Make sure to start it before injecting the chaos and set CERBERUS_ENABLED environment variable for the chaos injection container to autoconnect.
$ podman run \
--name=<container_name> \
--net=host \
--pull=always \
--env-host=true\
-v <path-to-kube-config>:/home/krkn/.kube/config:Z \
-d containers.krkn-chaos.dev/krkn-chaos/krkn-hub:service-disruption-scenarios
$ podman logs -f <container_name or container_id> # Streams Kraken logs$ podman inspect <container-name or container-id> \
--format "{{.State.ExitCode}}"# Outputs exit code which can considered as pass/fail for the scenario
Note
–env-host: This option is not available with the remote Podman client, including Mac and Windows (excluding WSL2) machines.
Without the –env-host option you’ll have to set each environment variable on the podman command line like -e <VARIABLE>=<value>
$ docker run $(./get_docker_params.sh)\
--name=<container_name> \
--net=host \
--pull=always \
-v <path-to-kube-config>:/home/krkn/.kube/config:Z \
-d containers.krkn-chaos.dev/krkn-chaos/krkn-hub:service-disruption-scenarios
$ docker run \
-e <VARIABLE>=<value> \
--net=host \
--pull=always \
-v <path-to-kube-config>:/home/krkn/.kube/config:Z \
-d containers.krkn-chaos.dev/krkn-chaos/krkn-hub:service-disruption-scenarios
$ docker logs -f <container_name or container_id> # Streams Kraken logs$ docker inspect <container-name or container-id> \
--format "{{.State.ExitCode}}"# Outputs exit code which can considered as pass/fail for the scenario
Tip
Because the container runs with a non-root user, ensure the kube config is globally readable before mounting it in the container. You can achieve this with the following commands:
kubectl config view --flatten > ~/kubeconfig && chmod 444 ~/kubeconfig && docker run $(./get_docker_params.sh) --name=<container_name> --net=host --pull=always -v ~kubeconfig:/home/krkn/.kube/config:Z -d containers.krkn-chaos.dev/krkn-chaos/krkn-hub:<scenario>
Supported parameters
The following environment variables can be set on the host running the container to tweak the scenario/faults being injected:
Example if –env-host is used:
export <parameter_name>=<value>
OR on the command line like example:
-e <VARIABLE>=<value>
See list of variables that apply to all scenarios here that can be used/set in addition to these scenario specific variables
Parameter
Description
Default
LABEL_SELECTOR
Label of the namespace to target. Set this parameter only if NAMESPACE is not set
""
NAMESPACE
Name of the namespace you want to target. Set this parameter only if LABEL_SELECTOR is not set
“openshift-etcd”
SLEEP
Number of seconds to wait before polling to see if namespace exists again
15
DELETE_COUNT
Number of namespaces to kill in each run, based on matching namespace and label specified
1
RUNS
Number of runs to execute the action
1
Note
In case of using custom metrics profile or alerts profile when CAPTURE_METRICS or ENABLE_ALERTS is enabled, mount the metrics profile from the host on which the container is run using podman/docker under /home/krkn/kraken/config/metrics-aggregated.yaml and /home/krkn/kraken/config/alerts.
Label of the namespace to target. Set this parameter only if NAMESPACE is not set
string
--delete-count
Number of namespaces to kill in each run, based on matching namespace and label specified
number
1
--runs
Number of runs to execute the action
number
1
To see all available scenario options
krknctl run service-disruption-scenarios --help
Demo
You can find a link to a demo of the scenario here
11.21 - Service Hijacking Scenario
Service Hijacking Scenarios aim to simulate fake HTTP responses from a workload targeted by a Service already deployed in the cluster. This scenario is executed by deploying a custom-made web service and modifying the target Service selector to direct traffic to this web service for a specified duration.
It employs a time-based test plan from the scenario configuration file, which specifies the behavior of resources during the chaos scenario as follows:
The scenario will focus on the service_name within the service_namespace,
substituting the selector with a randomly generated one, which is added as a label in the mock service manifest.
This allows multiple scenarios to be executed in the same namespace, each targeting different services without causing conflicts.
The newly deployed mock web service will expose a service_target_port,
which can be either a named or numeric port based on the service configuration.
This ensures that the Service correctly routes HTTP traffic to the mock web service during the chaos run.
Each step will last for duration seconds from the deployment of the mock web service in the cluster.
For each HTTP resource, defined as a top-level YAML property of the plan
(it could be a specific resource, e.g., /list/index.php, or a path-based resource typical in MVC frameworks),
one or more HTTP request methods can be specified. Both standard and custom request methods are supported.
During this time frame, the web service will respond with:
mime_type: The MIME type (can be standard or custom).
payload: The response body to be returned to the client.
At the end of the step duration, the web service will proceed to the next step (if available) until
the global chaos_duration concludes. At this point, the original service will be restored,
and the custom web service and its resources will be undeployed.
NOTE: Some clients (e.g., cURL, jQuery) may optimize queries using lightweight methods (like HEAD or OPTIONS)
to probe API behavior. If these methods are not defined in the test plan, the web service may respond with
a 405 or 404 status code. If you encounter unexpected behavior, consider this use case.
How to Run Service Hijacking Scenarios
Choose your preferred method to run service hijacking scenarios:
service_target_port:http-web-svc# The port of the service to be hijacked (can be named or numeric, based on the workload and service configuration).service_name:nginx-service# The name of the service that will be hijacked.service_namespace:default# The namespace where the target service is located.image:quay.io/krkn-chaos/krkn-service-hijacking:v0.1.3# Image of the krkn web service to be deployed to receive traffic.chaos_duration:30# Total duration of the chaos scenario in seconds.privileged:True# True or false if need privileged securityContext to runplan:- resource:"/list/index.php"# Specifies the resource or path to respond to in the scenario. For paths, both the path and query parameters are captured but ignored. For resources, only query parameters are captured.steps:# A time-based plan consisting of steps can be defined for each resource.GET: # One or more HTTP methods can be specified for each step. Note:Non-standard methods are supported for fully custom web services (e.g., using NONEXISTENT instead of POST).- duration:15# Duration in seconds for this step before moving to the next one, if defined. Otherwise, this step will continue until the chaos scenario ends.status:500# HTTP status code to be returned in this step.mime_type:"application/json"# MIME type of the response for this step.payload:| # The response payload for this step.{"status":"internal server error"}- duration:15status:201mime_type:"application/json"payload:| {
"status":"resource created"
}POST:- duration:15status:401mime_type:"application/json"payload:| {
"status": "unauthorized"
}- duration:15status:404mime_type:"text/plain"payload:"not found"
How to Use Plugin Name
Add the plugin name to the list of chaos_scenarios section in the config/config.yaml file
kraken:kubeconfig_path:~/.kube/config # Path to kubeconfig..chaos_scenarios:- service_hijacking_scenarios:- scenarios/<scenario_name>.yaml
Note
You can specify multiple scenario files of the same type by adding additional paths to the list:
You can also combine multiple different scenario types in the same config.yaml file. Scenario types can be specified in any order, and you can include the same scenario type multiple times:
kraken:chaos_scenarios:- service_hijacking_scenarios:- scenarios/service-hijack.yaml- pod_disruption_scenarios:- scenarios/pod-kill.yaml- network_chaos_scenarios:- scenarios/network-chaos.yaml- service_hijacking_scenarios:# Same type can appear multiple times- scenarios/service-hijack-2.yaml
Run
python run_kraken.py --config config/config.yaml
This scenario reroutes traffic intended for a target service to a custom web service that is automatically deployed by Krkn.
This web service responds with user-defined HTTP statuses, MIME types, and bodies.
For more details, please refer to the following documentation.
Run
Unlike other krkn-hub scenarios, this one requires a specific configuration due to its unique structure.
You must set up the scenario in a local file following the scenario syntax,
and then pass this file’s base64-encoded content to the container via the SCENARIO_BASE64 variable.
If enabling Cerberus to monitor the cluster and pass/fail the scenario post chaos, refer docs.
Make sure to start it before injecting the chaos and set CERBERUS_ENABLED
environment variable for the chaos injection container to autoconnect.
$ podman run --name=<container_name> \
-e SCENARIO_BASE64="$(base64 -w0 <scenario_file>)"\
-v <path_to_kubeconfig>:/home/krkn/.kube/config:Z containers.krkn-chaos.dev/krkn-chaos/krkn-hub:service-hijacking
$ podman logs -f <container_name or container_id> # Streams Kraken logs$ podman inspect <container-name or container-id> \
--format "{{.State.ExitCode}}"# Outputs exit code which can considered as pass/fail for the scenario
Note
–env-host: This option is not available with the remote Podman client, including Mac and Windows (excluding WSL2) machines.
Without the –env-host option you’ll have to set each environment variable on the podman command line like -e <VARIABLE>=<value>
$ exportSCENARIO_BASE64="$(base64 -w0 <scenario_file>)"$ docker run $(./get_docker_params.sh) --name=<container_name> \
--net=host --pull=always \
-v <path-to-kube-config>:/home/krkn/.kube/config:Z \
-d containers.krkn-chaos.dev/krkn-chaos/krkn-hub:service-hijacking
OR
$ docker run --name=<container_name> -e SCENARIO_BASE64="$(base64 -w0 <scenario_file>)"\
--net=host --pull=always \
-v <path-to-kube-config>:/home/krkn/.kube/config:Z \
-d containers.krkn-chaos.dev/krkn-chaos/krkn-hub:service-hijacking
$ docker logs -f <container_name or container_id> # Streams Kraken logs$ docker inspect <container-name or container-id> \
--format "{{.State.ExitCode}}"# Outputs exit code which can considered as pass/fail for the scenario
Tip
ecause the container runs with a non-root user, ensure the kube config is globally readable before mounting it in the container. You can achieve this with the following commands:
The following environment variables can be set on the host running the container to tweak the scenario/faults being injected:
example:
export <parameter_name>=<value>
See list of variables that apply to all scenarios here that can be used/set in addition to these scenario specific variables
Parameter
Description
SCENARIO_BASE64
Base64 encoded service-hijacking scenario file. Note that the -w0 option in the command substitution SCENARIO_BASE64="$(base64 -w0 <scenario_file>)" is mandatory in order to remove line breaks from the base64 command output
A sample scenario file can be found here, you’ll need to customize it based on your wanted response codes for API calls
Note
In case of using custom metrics profile or alerts profile when CAPTURE_METRICS or ENABLE_ALERTS is enabled, mount the metrics profile from the host on which the container is run using podman/docker under /home/krkn/kraken/config/metrics-aggregated.yaml and /home/krkn/kraken/config/alerts.
The absolute path of the scenario file compiled following the documentation
file_base64
A sample scenario file can be found here, you’ll need to customize it based on your wanted response codes for API calls
Note
Note that the -w0 option in the command substitution SCENARIO_BASE64="$(base64 -w0 <scenario_file>)" is mandatory in order to remove line breaks from the base64 command output
To see all available scenario options
krknctl run service-hijacking --help
11.22 - Syn Flood Scenarios
Syn Flood Scenarios
This scenario generates a substantial amount of TCP traffic directed at one or more Kubernetes services within
the cluster to test the server’s resiliency under extreme traffic conditions.
It can also target hosts outside the cluster by specifying a reachable IP address or hostname.
This scenario leverages the distributed nature of Kubernetes clusters to instantiate multiple instances
of the same pod against a single host, significantly increasing the effectiveness of the attack.
The configuration also allows for the specification of multiple node selectors, enabling Kubernetes to schedule
the attacker pods on a user-defined subset of nodes to make the test more realistic.
The attacker container source code is available here.
How to Run Syn Flood Scenarios
Choose your preferred method to run syn flood scenarios:
packet-size:120# hping3 packet sizewindow-size:64# hping 3 TCP window sizeduration:10# chaos scenario durationnamespace:default# namespace where the target service(s) are deployedtarget-service:target-svc# target service name (if set target-service-label must be empty)target-port:80# target service TCP porttarget-service-label :""# target service label, can be used to target multiple target at the same time# if they have the same label set (if set target-service must be empty)number-of-pods:2# number of attacker pod instantiated per each targetimage:quay.io/krkn-chaos/krkn-syn-flood# syn flood attacker container imageattacker-nodes:# this will set the node affinity to schedule the attacker node. Per each node label selector# can be specified multiple values in this way the kube scheduler will schedule the attacker pods# in the best way possible based on the provided labels. Multiple labels can be specifiedkubernetes.io/hostname:- host_1- host_2kubernetes.io/os:- linux
How to Use Plugin Name
Add the plugin name to the list of chaos_scenarios section in the config/config.yaml file
kraken:kubeconfig_path:~/.kube/config # Path to kubeconfig..chaos_scenarios:- syn_flood_scenarios:- scenarios/<scenario_name>.yaml
Note
You can specify multiple scenario files of the same type by adding additional paths to the list:
You can also combine multiple different scenario types in the same config.yaml file. Scenario types can be specified in any order, and you can include the same scenario type multiple times:
kraken:chaos_scenarios:- syn_flood_scenarios:- scenarios/syn-flood.yaml- pod_disruption_scenarios:- scenarios/pod-kill.yaml- network_chaos_scenarios:- scenarios/network-chaos.yaml- syn_flood_scenarios:# Same type can appear multiple times- scenarios/syn-flood-2.yaml
Run
python run_kraken.py --config config/config.yaml
Syn Flood scenario
This scenario simulates a user-defined surge of TCP SYN requests directed at one or more services deployed within the cluster or an external target reachable by the cluster.
For more details, please refer to the following documentation.
Run
If enabling Cerberus to monitor the cluster and pass/fail the scenario post chaos, refer docs. Make sure to start it before injecting the chaos and set CERBERUS_ENABLED environment variable for the chaos injection container to autoconnect.
–env-host: This option is not available with the remote Podman client, including Mac and Windows (excluding WSL2) machines.
Without the –env-host option you’ll have to set each environment variable on the podman command line like -e <VARIABLE>=<value>
TIP: Because the container runs with a non-root user, ensure the kube config is globally readable before mounting it in the container. You can achieve this with the following commands:
The following environment variables can be set on the host running the container to tweak the scenario/faults being injected:
Example if –env-host is used:
export <parameter_name>=<value>
OR on the command line like example:
-e <VARIABLE>=<value>
See list of variables that apply to all scenarios here that can be used/set in addition to these scenario specific variables
Parameter
Description
Default
PACKET_SIZE
The size in bytes of the SYN packet
120
WINDOW_SIZE
The TCP window size between packets in bytes
64
TOTAL_CHAOS_DURATION
The number of seconds the chaos will last
120
NAMESPACE
The namespace containing the target service and where the attacker pods will be deployed
default
TARGET_SERVICE
The service name (or the hostname/IP address in case an external target will be hit) that will be affected by the attack. Must be empty if TARGET_SERVICE_LABEL will be set
TARGET_PORT
The TCP port that will be targeted by the attack
TARGET_SERVICE_LABEL
The label that will be used to select one or more services. Must be left empty if TARGET_SERVICE variable is set
NUMBER_OF_PODS
The number of attacker pods that will be deployed
2
IMAGE
The container image that will be used to perform the scenario
quay.io/krkn-chaos/krkn-syn-flood:latest
NODE_SELECTORS
The node selectors are used to guide the cluster on where to deploy attacker pods. You can specify one or more labels in the format key=value;key=value2 (even using the same key) to choose one or more node categories. If left empty, the pods will be scheduled on any available node, depending on the cluster’s capacity.
NOTE In case of using custom metrics profile or alerts profile when CAPTURE_METRICS or ENABLE_ALERTS is enabled, mount the metrics profile from the host on which the container is run using podman/docker under /home/krkn/kraken/config/metrics-aggregated.yaml and /home/krkn/kraken/config/alerts. For example:
The namespace containing the target service and where the attacker pods will be deployed
string
default
--target-service
The service name (or the hostname/IP address in case an external target will be hit) that will be affected by the attack.Must be empty if TARGET_SERVICE_LABEL will be set
string
--target-port
The TCP port that will be targeted by the attack
number
--target-service-label
The label that will be used to select one or more services.Must be left empty if TARGET_SERVICE variable is set
string
--number-of-pods
The number of attacker pods that will be deployed
number
2
--image
The container image that will be used to perform the scenario
string
quay.io/krkn-chaos/krkn-syn-flood:latest
--node-selectors
The node selectors are used to guide the cluster on where to deploy attacker pods. You can specify one or more labels in the format key=value;key=value2 (even using the same key) to choose one or more node categories. If left empty, the pods will be scheduled on any available node, depending on the cluster s capacity.
string
To see all available scenario options
krknctl run syn-flood --help
11.23 - Time Scenarios
Using this type of scenario configuration, one is able to change the time and/or date of the system for pods or nodes.
How to Run Time Scenarios
Choose your preferred method to run time scenarios:
You can also combine multiple different scenario types in the same config.yaml file. Scenario types can be specified in any order, and you can include the same scenario type multiple times:
kraken:chaos_scenarios:- time_scenarios:- scenarios/time-skew.yaml- pod_disruption_scenarios:- scenarios/pod-kill.yaml- node_scenarios:- scenarios/node-reboot.yaml- time_scenarios:# Same type can appear multiple times- scenarios/time-skew-2.yaml
Run
python run_kraken.py --config config/config.yaml
This scenario skews the date and time of the nodes and pods matching the label on a Kubernetes/OpenShift cluster. More information can be found here.
Run
If enabling Cerberus to monitor the cluster and pass/fail the scenario post chaos, refer docs. Make sure to start it before injecting the chaos and set CERBERUS_ENABLED environment variable for the chaos injection container to autoconnect.
$ podman run \
--name=<container_name> \
--net=host \
--pull=always \
--env-host=true\
-v <path-to-kube-config>:/home/krkn/.kube/config:Z \
-d containers.krkn-chaos.dev/krkn-chaos/krkn-hub:time-scenarios
$ podman logs -f <container_name or container_id> # Streams Kraken logs$ podman inspect <container-name or container-id> \
--format "{{.State.ExitCode}}"# Outputs exit code which can considered as pass/fail for the scenario
Note
–env-host: This option is not available with the remote Podman client, including Mac and Windows (excluding WSL2) machines.
Without the –env-host option you’ll have to set each environment variable on the podman command line like -e <VARIABLE>=<value>
$ docker run $(./get_docker_params.sh)\
--name=<container_name> \
--net=host \
--pull=always \
-v <path-to-kube-config>:/home/krkn/.kube/config:Z \
-d containers.krkn-chaos.dev/krkn-chaos/krkn-hub:time-scenarios
$ docker run \
-e <VARIABLE>=<value> \
--name=<container_name> \
--net=host \
--pull=always \
-v <path-to-kube-config>:/home/krkn/.kube/config:Z \
-d containers.krkn-chaos.dev/krkn-chaos/krkn-hub:time-scenarios
$ docker logs -f <container_name or container_id> # Streams Kraken logs$ docker inspect <container-name or container-id> \
--format "{{.State.ExitCode}}"# Outputs exit code which can considered as pass/fail for the scenario
Tip
Because the container runs with a non-root user, ensure the kube config is globally readable before mounting it in the container. You can achieve this with the following commands:
The following environment variables can be set on the host running the container to tweak the scenario/faults being injected:
example:
export <parameter_name>=<value>
See list of variables that apply to all scenarios here that can be used/set in addition to these scenario specific variables
Parameter
Description
Default
OBJECT_TYPE
Object to target. Supported options: pod, node
pod
LABEL_SELECTOR
Label of the container(s) or nodes to target
k8s-app=etcd
ACTION
Action to run. Supported actions: skew_time, skew_date
skew_date
OBJECT_NAME
List of the names of pods or nodes you want to skew ( optional parameter )
[]
CONTAINER_NAME
Container in the specified pod to target in case the pod has multiple containers running. Random container is picked if empty
""
NAMESPACE
Namespace of the pods you want to skew, need to be set only if setting a specific pod name
""
Note
In case of using custom metrics profile or alerts profile when CAPTURE_METRICS or ENABLE_ALERTS is enabled, mount the metrics profile from the host on which the container is run using podman/docker under /home/krkn/kraken/config/metrics-aggregated.yaml and /home/krkn/kraken/config/alerts.
Action to run. Supported actions: skew_time or skew_date
enum
skew_date
--object-names
List of the names of pods or nodes you want to skew
string
--container-name
Container in the specified pod to target in case the pod has multiple containers running. Random container is picked if empty
string
--namespace
Namespace of the pods you want to skew, need to be set only if setting a specific pod name
string
To see all available scenario options
krknctl run time-scenarios --help
Demo
See a demo of this scenario:
11.24 - Zone Outage Scenarios
Scenario to create outage in a targeted zone in the public cloud to understand the impact on both Kubernetes/OpenShift control plane as well as applications running on the worker nodes in that zone.
There are 2 ways these scenarios run:
For AWS, it tweaks the network acl of the zone to simulate the failure and that in turn will stop both ingress and egress traffic from all the nodes in a particular zone for the specified duration and reverts it back to the previous state.
For GCP, it in a specific zone you want to target and finds the nodes (master, worker, and infra) and stops the nodes for the set duration and then starts them back up. The reason we do it this way is because any edits to the nodes require you to first stop the node before performing any updates. So, editing the network as the AWS way would still require you to stop the nodes first.
How to Run Zone Outage Scenarios
Choose your preferred method to run zone outage scenarios:
Zone outage can be injected by placing the zone_outage config file under zone_outages option in the kraken config. Refer to zone_outage_scenario config file for the parameters that need to be defined.
zone_outage:# Scenario to create an outage of a zone by tweaking network ACL.cloud_type:aws # Cloud type on which Kubernetes/OpenShift runs. aws is the only platform supported currently for this scenario.duration:600# Duration in seconds after which the zone will be back online.vpc_id:# Cluster virtual private network to target.subnet_id:[subnet1, subnet2] # List of subnet-id's to deny both ingress and egress traffic.
Note
vpc_id and subnet_id can be obtained from the cloud web console by selecting one of the instances in the targeted zone ( us-west-2a for example ).
zone_outage:# Scenario to create an outage of a zone by tweaking network ACLcloud_type:gcp # cloud type on which Kubernetes/OpenShift runs. aws is only platform supported currently for this scenario.duration:600# duration in seconds after which the zone will be back onlinezone:<zone> # Zone of nodes to stop and then restart after the duration endskube_check:True# Run kubernetes api calls to see if the node gets to a certain state during the scenario
Note
Multiple zones will experience downtime in case of targeting multiple subnets which might have an impact on the cluster health especially if the zones have control plane components deployed.
AWS- Debugging steps in case of failures
In case of failures during the steps which revert back the network acl to allow traffic and bring back the cluster nodes in the zone, the nodes in the particular zone will be in NotReady condition. Here is how to fix it:
OpenShift by default deploys the nodes in different zones for fault tolerance, for example us-west-2a, us-west-2b, us-west-2c. The cluster is associated with a virtual private network and each zone has its own subnet with a network acl which defines the ingress and egress traffic rules at the zone level unlike security groups which are at an instance level.
From the cloud web console, select one of the instances in the zone which is down and go to the subnet_id specified in the config.
Look at the network acl associated with the subnet and you will see both ingress and egress traffic being denied which is expected as Kraken deliberately injects it.
Kraken just switches the network acl while still keeping the original or default network acl around, switching to the default network acl from the drop-down menu will get back the nodes in the targeted zone into Ready state.
GCP - Debugging steps in case of failures
In case of failures during the steps which bring back the cluster nodes in the zone, the nodes in the particular zone will be in NotReady condition. Here is how to fix it:
From the gcp web console, select one of the instances in the zone which is down
Kraken just stops the node, so you’ll just have to select the stopped nodes and START them. This will get back the nodes in the targeted zone into Ready state
How to Use Plugin Name
Add the plugin name to the list of chaos_scenarios section in the config/config.yaml file
kraken:kubeconfig_path:~/.kube/config # Path to kubeconfig..chaos_scenarios:- zone_outages_scenarios:- scenarios/<scenario_name>.yaml
Note
You can specify multiple scenario files of the same type by adding additional paths to the list:
You can also combine multiple different scenario types in the same config.yaml file. Scenario types can be specified in any order, and you can include the same scenario type multiple times:
kraken:chaos_scenarios:- zone_outages_scenarios:- scenarios/zone-outage.yaml- pod_disruption_scenarios:- scenarios/pod-kill.yaml- node_scenarios:- scenarios/node-reboot.yaml- zone_outages_scenarios:# Same type can appear multiple times- scenarios/zone-outage-2.yaml
Run
python run_kraken.py --config config/config.yaml
This scenario disrupts a targeted zone in the public cloud by blocking egress and ingress traffic to understand the impact on both Kubernetes/OpenShift platforms control plane as well as applications running on the worker nodes in that zone. More information is documented here
Run
If enabling Cerberus to monitor the cluster and pass/fail the scenario post chaos, refer docs. Make sure to start it before injecting the chaos and set CERBERUS_ENABLED environment variable for the chaos injection container to autoconnect.
$ podman run \
--name=<container_name> \
--net=host \
--pull=always \
--env-host=true\
-v <path-to-kube-config>:/home/krkn/.kube/config:Z \
-d containers.krkn-chaos.dev/krkn-chaos/krkn-hub:zone-outages
$ podman logs -f <container_name or container_id> # Streams Kraken logs$ podman inspect <container-name or container-id> \
--format "{{.State.ExitCode}}"# Outputs exit code which can considered as pass/fail for the scenario
Note
–env-host: This option is not available with the remote Podman client, including Mac and Windows (excluding WSL2) machines.
Without the –env-host option you’ll have to set each environment variable on the podman command line like -e <VARIABLE>=<value>
$ docker run $(./get_docker_params.sh)\
--name=<container_name> \
--net=host \
--pull=always \
-v <path-to-kube-config>:/home/krkn/.kube/config:Z \
-d containers.krkn-chaos.dev/krkn-chaos/krkn-hub:zone-outages
$ docker run \
-e <VARIABLE>=<value> \
--name=<container_name> \
--net=host \
--pull=always \
-v <path-to-kube-config>:/home/krkn/.kube/config:Z \
-d containers.krkn-chaos.dev/krkn-chaos/krkn-hub:zone-outages
$ docker logs -f <container_name or container_id> # Streams Kraken logs$ docker inspect <container-name or container-id> \
--format "{{.State.ExitCode}}"# Outputs exit code which can considered as pass/fail for the scenario
Tip
Because the container runs with a non-root user, ensure the kube config is globally readable before mounting it in the container. You can achieve this with the following commands:
kubectl config view --flatten > ~/kubeconfig && chmod 444 ~/kubeconfig && docker run $(./get_docker_params.sh) --name=<container_name> --net=host --pull=always -v ~kubeconfig:/home/krkn/.kube/config:Z -d containers.krkn-chaos.dev/krkn-chaos/krkn-hub:<scenario>
Supported parameters
The following environment variables can be set on the host running the container to tweak the scenario/faults being injected:
Example if –env-host is used:
export <parameter_name>=<value>
OR on the command line like example:
-e <VARIABLE>=<value>
See list of variables that apply to all scenarios here that can be used/set in addition to these scenario specific variables
In case of using custom metrics profile or alerts profile when CAPTURE_METRICS or ENABLE_ALERTS is enabled, mount the metrics profile from the host on which the container is run using podman/docker under /home/krkn/kraken/config/metrics-aggregated.yaml and /home/krkn/kraken/config/alerts.
Cloud platform on top of which cluster is running, supported platforms - aws, gcp
enum
aws
--duration
Duration in seconds after which the zone will be back online
number
600
--vpc-id
cluster virtual private network to target
string
--subnet-id
subnet-id to deny both ingress and egress traffic ( REQUIRED ). Format: [subnet1, subnet2]
string
--zone
cluster zone to target (only for gcp cloud type )
string
--kube-check
Connecting to the kubernetes api to check the node status, set to False for SNO
enum
--aws-access-key-id
AWS Access Key Id
string (secret)
--aws-secret-access-key
AWS Secret Access Key
string (secret)
--aws-default-region
AWS default region
string
--gcp-application-credentials
GCP application credentials file location
file
NOTE: The secret string types will be masked when scenario is ran
To see all available scenario options
krknctl run zone-outages --help
Demo
You can find a link to a demo of the scenario here
12 - Cerberus
Guardian of kubernetes
Cerberus
Guardian of Kubernetes and OpenShift Clusters
Cerberus watches the Kubernetes/OpenShift clusters for dead nodes, system component failures/health and exposes a go or no-go signal which can be consumed by other workload generators or applications in the cluster and act accordingly.
Workflow
Installation
Instructions on how to setup, configure and run Cerberus can be found at Installation.
What Kubernetes/OpenShift components can Cerberus monitor?
Following are the components of Kubernetes/OpenShift that Cerberus can monitor today, we will be adding more soon.
Component
Description
Working
Nodes
Watches all the nodes including masters, workers as well as nodes created using custom MachineSets
✔️
Namespaces
Watches all the pods including containers running inside the pods in the namespaces specified in the config
✔️
Cluster Operators
Watches all Cluster Operators
✔️
Masters Schedulability
Watches and warns if masters nodes are marked as schedulable
✔️
Routes
Watches specified routes
✔️
CSRs
Warns if any CSRs are not approved
✔️
Critical Alerts
Warns the user on observing abnormal behavior which might affect the health of the cluster
✔️
Bring your own checks
Users can bring their own checks and Cerberus runs and includes them in the reporting as well as go/no-go signal
✔️
An explanation of all the components that Cerberus can monitor are explained here
How does Cerberus report cluster health?
Cerberus exposes the cluster health and failures through a go/no-go signal, report and metrics API.
Go or no-go signal
When the cerberus is configured to run in the daemon mode, it will continuously monitor the components specified, runs a light weight http server at http://0.0.0.0:8080 and publishes the signal i.e True or False depending on the components status. The tools can consume the signal and act accordingly.
Report
The report is generated in the run directory and it contains the information about each check/monitored component status per iteration with timestamps. It also displays information about the components in case of failure. Refer report for example.
You can use the “-o <file_path_name>” option to change the location of the created report
Metrics API
Cerberus exposes the metrics including the failures observed during the run through an API. Tools consuming Cerberus can query the API to get a blob of json with the observed failures to scrape and act accordingly. For example, we can query for etcd failures within a start and end time and take actions to determine pass/fail for test cases or report whether the cluster is healthy or unhealthy for that duration.
The failures in the past 1 hour can be retrieved in the json format by visiting http://0.0.0.0:8080/history.
The failures in a specific time window can be retrieved in the json format by visiting http://0.0.0.0:8080/history?loopback=.
The failures between two time timestamps, the failures of specific issues types and the failures related to specific components can be retrieved in the json format by visiting http://0.0.0.0:8080/analyze url. The filters have to be applied to scrape the failures accordingly.
Slack integration
Cerberus supports reporting failures in slack. Refer slack integration for information on how to set it up.
Node Problem Detector
Cerberus also consumes node-problem-detector to detect various failures in Kubernetes/OpenShift nodes. More information on setting it up can be found at node-problem-detector
Bring your own checks
Users can add additional checks to monitor components that are not being monitored by Cerberus and consume it as part of the go/no-go signal. This can be accomplished by placing relative paths of files containing additional checks under custom_checks in config file. All the checks should be placed within the main function of the file. If the additional checks need to be considered in determining the go/no-go signal of Cerberus, the main function can return a boolean value for the same. Having a dict return value of the format {‘status’:status, ‘message’:message} shall send signal to Cerberus along with message to be displayed in slack notification. However, it’s optional to return a value.
Refer to example_check for an example custom check file.
Alerts
Monitoring metrics and alerting on abnormal behavior is critical as they are the indicators for clusters health. Information on supported alerts can be found at alerts.
Use cases
There can be number of use cases, here are some of them:
We run tools to push the limits of Kubernetes/OpenShift to look at the performance and scalability. There are a number of instances where system components or nodes start to degrade, which invalidates the results and the workload generator continues to push the cluster until it is unrecoverable.
When running chaos experiments on a kubernetes/OpenShift cluster, they can potentially break the components unrelated to the targeted components which means that the chaos experiment won’t be able to find it. The go/no-go signal can be used here to decide whether the cluster recovered from the failure injection as well as to decide whether to continue with the next chaos scenario.
Tools consuming Cerberus
Benchmark Operator: The intent of this Operator is to deploy common workloads to establish a performance baseline of Kubernetes cluster on your provider. Benchmark Operator consumes Cerberus to determine if the cluster was healthy during the benchmark run. More information can be found at cerberus-integration.
Kraken: Tool to inject deliberate failures into Kubernetes/OpenShift clusters to check if it is resilient. Kraken consumes Cerberus to determine if the cluster is healthy as a whole in addition to the targeted component during chaos testing. More information can be found at cerberus-integration.
We are always looking for more enhancements, fixes to make it better, any contributions are most welcome. Feel free to report or work on the issues filed on github.
NOTE: When config file location is not passed, default config is used.
Python Package
Cerberus is also available as a python package to ease the installation and setup.
To install the latest release:
$ pip3 install cerberus-client
Configure and Run
Setup the config according to your requirements. Information on the available options can be found at usage.
Run
$ cerberus_client -c <config_file_location>`
Note
When config_file_location is not passed, default config is used.
Note
It’s recommended to run Cerberus either using the containerized or github version to be able to use the latest enhancements and fixes.
Containerized version
Assuming docker ( 17.05 or greater with multi-build support ) is installed on the host, run:
$ docker pull quay.io/redhat-chaos/cerberus
# Setup the [config](https://github.com/redhat-chaos/cerberus/tree/master/config) according to your requirements. Information on the available options can be found at [usage](usage.md).$ docker run \
--name=cerberus \
--net=host \
-v <path_to_kubeconfig>:/root/.kube/config \
-v <path_to_cerberus_config>:/root/cerberus/config/config.yaml \
-d quay.io/redhat-chaos/cerberus:latest
$ docker logs -f cerberus
Similarly, podman can be used to achieve the same:
$ podman pull quay.io/redhat-chaos/cerberus
# Setup the [config](https://github.com/redhat-chaos/cerberus/tree/master/config) according to your requirements. Information on the available options can be found at [usage](usage.md).$ podman run \
--name=cerberus \
--net=host \
-v <path_to_kubeconfig>:/root/.kube/config:Z \
-v <path_to_cerberus_config>:/root/cerberus/config/config.yaml:Z \
-d quay.io/redhat-chaos/cerberus:latest
$ podman logs -f cerberus
The go/no-go signal ( True or False ) gets published at http://<hostname>:8080. Note that the cerberus will only support ipv4 for the time being.
Note
The report is generated at /root/cerberus/cerberus.report inside the container, it can mounted to a directory on the host in case we want to capture it.
If you want to build your own Cerberus image, see here.
To run Cerberus on Power (ppc64le) architecture, build and run a containerized version by following the instructions given here.
Run containerized Cerberus as a Kubernetes/OpenShift deployment
Refer to the instructions for information on how to run cerberus as a Kubernetes or OpenShift application.
Set the components to monitor and the tunings like duration to wait between each check in the config file located at config/config.yaml. A sample config looks like:
cerberus:distribution:openshift # Distribution can be kubernetes or openshiftkubeconfig_path:/root/.kube/config # Path to kubeconfigport:8081# http server port where cerberus status is publishedwatch_nodes:True# Set to True for the cerberus to monitor the cluster nodeswatch_cluster_operators:True# Set to True for cerberus to monitor cluster operatorswatch_terminating_namespaces:True# Set to True to monitor if any namespaces (set below under 'watch_namespaces' start terminatingwatch_url_routes:# Route url's you want to monitor, this is a double array with the url and optional authorization parameterwatch_master_schedulable:# When enabled checks for the schedulable master nodes with given label.enabled:Truelabel:node-role.kubernetes.io/masterwatch_namespaces:# List of namespaces to be monitored- openshift-etcd- openshift-apiserver- openshift-kube-apiserver- openshift-monitoring- openshift-kube-controller-manager- openshift-machine-api- openshift-kube-scheduler- openshift-ingress- openshift-sdn # When enabled, it will check for the cluster sdn and monitor that namespacewatch_namespaces_ignore_pattern:[]# Ignores pods matching the regex pattern in the namespaces specified under watch_namespacescerberus_publish_status:True# When enabled, cerberus starts a light weight http server and publishes the statusinspect_components:False# Enable it only when OpenShift client is supported to run# When enabled, cerberus collects logs, events and metrics of failed componentsprometheus_url:# The prometheus url/route is automatically obtained in case of OpenShift, please set it when the distribution is Kubernetes.prometheus_bearer_token:# The bearer token is automatically obtained in case of OpenShift, please set it when the distribution is Kubernetes. This is needed to authenticate with prometheus.# This enables Cerberus to query prometheus and alert on observing high Kube API Server latencies.slack_integration:False# When enabled, cerberus reports the failed iterations in the slack channel# The following env vars needs to be set: SLACK_API_TOKEN ( Bot User OAuth Access Token ) and SLACK_CHANNEL ( channel to send notifications in case of failures )# When slack_integration is enabled, a watcher can be assigned for each day. The watcher of the day is tagged while reporting failures in the slack channel. Values are slack member ID's.watcher_slack_ID: # (NOTE:Defining the watcher id's is optional and when the watcher slack id's are not defined, the slack_team_alias tag is used if it is set else no tag is used while reporting failures in the slack channel.)Monday:Tuesday:Wednesday:Thursday:Friday:Saturday:Sunday:slack_team_alias:# The slack team alias to be tagged while reporting failures in the slack channel when no watcher is assignedcustom_checks:- custom_checks/custom_check_sample.py # Relative paths of files containing additional user defined checkstunings:timeout:20# Number of seconds before requests failiterations:1# Iterations to loop before stopping the watch, it will be replaced with infinity when the daemon mode is enabledsleep_time:3# Sleep duration between each iterationkube_api_request_chunk_size:250# Large requests will be broken into the specified chunk size to reduce the load on API server and improve responsiveness.daemon_mode:True# Iterations are set to infinity which means that the cerberus will monitor the resources forevercores_usage_percentage:0.5# Set the fraction of cores to be used for multiprocessingdatabase:database_path:/tmp/cerberus.db # Path where cerberus database needs to be storedreuse_database:False# When enabled, the database is reused to store the failures
Watch Nodes
This flag returns any nodes where the KernelDeadlock is not set to False and does not have a Ready status
Watch Cluster Operators
When watch_cluster_operators is set to True, this will monitor the degraded status of all the cluster operators and report a failure if any are degraded.
If set to False will not query or report the status of the cluster operators
Watch Routes
This parameter expects a double array with each item having the url and an optional bearer token or authorization for each of the url’s to properly connect
When this check is enabled, cerberus queries each of the nodes for the given label and verifies the taint effect does not equal “NoSchedule”
watch_master_schedulable: # When enabled checks for the schedulable master nodes with given label.
enabled: True
label: <label of master nodes>
Watch Namespaces
It supports monitoring pods in any namespaces specified in the config, the watch is enabled for system components mentioned in the config by default as they are critical for running the operations on Kubernetes/OpenShift clusters.
watch_namespaces support regex patterns. Any valid regex pattern can be used to watch all the namespaces matching the regex pattern.
For example, ^openshift-.*$ can be used to watch all namespaces that start with openshift- or openshift can be used to watch all namespaces that have openshift in it.
Or you can use ^.*$ to watch all namespaces in your cluster
Watch Terminating Namespaces
When watch_terminating_namespaces is set to True, this will monitor the status of all the namespaces defined under watch namespaces and report a failure if any are terminating.
If set to False will not query or report the status of the terminating namespaces
Publish Status
Parameter to set if you want to publish the go/no-go signal to the http server
Inspect Components
inspect_components if set to True will perform an oc adm inspect namespace <namespace> when any namespace has any failing pods
Custom Checks
Users can add additional checks to monitor components that are not being monitored by Cerberus and consume it as part of the go/no-go signal. This can be accomplished by placing relative paths of files containing additional checks under custom_checks in config file. All the checks should be placed within the main function of the file. If the additional checks need to be considered in determining the go/no-go signal of Cerberus, the main function can return a boolean value for the same. Having a dict return value of the format {‘status’:status, ‘message’:message} shall send signal to Cerberus along with message to be displayed in slack notification. However, it’s optional to return a value.
Refer to example_check for an example custom check file.
12.3 - Example Report
2020-03-26 22:05:06,393 [INFO] Starting cerberus
2020-03-26 22:05:06,401 [INFO] Initializing client to talk to the Kubernetes cluster
2020-03-26 22:05:06,434 [INFO] Fetching cluster info
2020-03-26 22:05:06,739 [INFO] Publishing cerberus status at http://0.0.0.0:8080
2020-03-26 22:05:06,753 [INFO] Starting http server at http://0.0.0.0:8080
2020-03-26 22:05:06,753 [INFO] Daemon mode enabled, cerberus will monitor forever
2020-03-26 22:05:06,753 [INFO] Ignoring the iterations set2020-03-26 22:05:25,104 [INFO] Iteration 4: Node status: True
2020-03-26 22:05:25,133 [INFO] Iteration 4: Etcd member pods status: True
2020-03-26 22:05:25,161 [INFO] Iteration 4: OpenShift apiserver status: True
2020-03-26 22:05:25,546 [INFO] Iteration 4: Kube ApiServer status: True
2020-03-26 22:05:25,717 [INFO] Iteration 4: Monitoring stack status: True
2020-03-26 22:05:25,720 [INFO] Iteration 4: Kube controller status: True
2020-03-26 22:05:25,746 [INFO] Iteration 4: Machine API components status: True
2020-03-26 22:05:25,945 [INFO] Iteration 4: Kube scheduler status: True
2020-03-26 22:05:25,963 [INFO] Iteration 4: OpenShift ingress status: True
2020-03-26 22:05:26,077 [INFO] Iteration 4: OpenShift SDN status: True
2020-03-26 22:05:26,077 [INFO] HTTP requests served: 02020-03-26 22:05:26,077 [INFO] Sleeping for the specified duration: 52020-03-26 22:05:31,134 [INFO] Iteration 5: Node status: True
2020-03-26 22:05:31,162 [INFO] Iteration 5: Etcd member pods status: True
2020-03-26 22:05:31,190 [INFO] Iteration 5: OpenShift apiserver status: True
127.0.0.1 - - [26/Mar/2020 22:05:31]"GET / HTTP/1.1"200 -
2020-03-26 22:05:31,588 [INFO] Iteration 5: Kube ApiServer status: True
2020-03-26 22:05:31,759 [INFO] Iteration 5: Monitoring stack status: True
2020-03-26 22:05:31,763 [INFO] Iteration 5: Kube controller status: True
2020-03-26 22:05:31,788 [INFO] Iteration 5: Machine API components status: True
2020-03-26 22:05:31,989 [INFO] Iteration 5: Kube scheduler status: True
2020-03-26 22:05:32,007 [INFO] Iteration 5: OpenShift ingress status: True
2020-03-26 22:05:32,118 [INFO] Iteration 5: OpenShift SDN status: False
2020-03-26 22:05:32,118 [INFO] HTTP requests served: 12020-03-26 22:05:32,118 [INFO] Sleeping for the specified duration: 5+--------------------------------------------------Failed Components--------------------------------------------------+
2020-03-26 22:05:37,123 [INFO] Failed openshift sdn components: ['sdn-xmqhd']2020-05-23 23:26:43,041 [INFO] ------------------------- Iteration Stats ---------------------------------------------
2020-05-23 23:26:43,041 [INFO] Time taken to run watch_nodes in iteration 1: 0.0996248722076416 seconds
2020-05-23 23:26:43,041 [INFO] Time taken to run watch_cluster_operators in iteration 1: 0.3672499656677246 seconds
2020-05-23 23:26:43,041 [INFO] Time taken to run watch_namespaces in iteration 1: 1.085144281387329 seconds
2020-05-23 23:26:43,041 [INFO] Time taken to run entire_iteration in iteration 1: 4.107403039932251 seconds
2020-05-23 23:26:43,041 [INFO] ---------------------------------------------------------------------------------------
12.4 - Usage
Config
Set the supported components to monitor and the tunings like number of iterations to monitor and duration to wait between each check in the config file located at config/config.yaml. A sample config looks like:
cerberus:distribution:openshift # Distribution can be kubernetes or openshiftkubeconfig_path:~/.kube/config # Path to kubeconfigport:8080# http server port where cerberus status is publishedwatch_nodes:True# Set to True for the cerberus to monitor the cluster nodeswatch_cluster_operators:True# Set to True for cerberus to monitor cluster operators. Parameter is optional, will set to True if not specifiedwatch_url_routes:# Route url's you want to monitor- - https://...- Bearer **** # This parameter is optional, specify authorization need for get call to route- - http://...watch_master_schedulable:# When enabled checks for the schedulableenabled:Truemaster nodes with given label.label:node-role.kubernetes.io/masterwatch_namespaces:# List of namespaces to be monitored- openshift-etcd- openshift-apiserver- openshift-kube-apiserver- openshift-monitoring- openshift-kube-controller-manager- openshift-machine-api- openshift-kube-scheduler- openshift-ingress- openshift-sdncerberus_publish_status:True# When enabled, cerberus starts a light weight http server and publishes the statusinspect_components:False# Enable it only when OpenShift client is supported to run.# When enabled, cerberus collects logs, events and metrics of failed componentsprometheus_url:# The prometheus url/route is automatically obtained in case of OpenShift, please set it when the distribution is Kubernetes.prometheus_bearer_token:# The bearer token is automatically obtained in case of OpenShift, please set it when the distribution is Kubernetes. This is needed to authenticate with prometheus.# This enables Cerberus to query prometheus and alert on observing high Kube API Server latencies.slack_integration:False# When enabled, cerberus reports status of failed iterations in the slack channel# The following env vars need to be set: SLACK_API_TOKEN ( Bot User OAuth Access Token ) and SLACK_CHANNEL ( channel to send notifications in case of failures )# When slack_integration is enabled, a watcher can be assigned for each day. The watcher of the day is tagged while reporting failures in the slack channel. Values are slack member ID's.watcher_slack_ID: # (NOTE:Defining the watcher id's is optional and when the watcher slack id's are not defined, the slack_team_alias tag is used if it is set else no tag is used while reporting failures in the slack channel.)Monday:Tuesday:Wednesday:Thursday:Friday:Saturday:Sunday:slack_team_alias:# The slack team alias to be tagged while reporting failures in the slack channel when no watcher is assignedcustom_checks:# Relative paths of files containing additional user defined checks- custom_checks/custom_check_sample.py- custom_check.pytunings:iterations:5# Iterations to loop before stopping the watch, it will be replaced with infinity when the daemon mode is enabledsleep_time:60# Sleep duration between each iterationkube_api_request_chunk_size:250# Large requests will be broken into the specified chunk size to reduce the load on API server and improve responsiveness.daemon_mode:True# Iterations are set to infinity which means that the cerberus will monitor the resources forevercores_usage_percentage:0.5# Set the fraction of cores to be used for multiprocessingdatabase:database_path:/tmp/cerberus.db # Path where cerberus database needs to be storedreuse_database:False# When enabled, the database is reused to store the failures
Note
watch_namespaces support regex patterns. Any valid regex pattern can be used to watch all the namespaces matching the regex pattern. For example, ^openshift-.*$ can be used to watch all namespaces that start with openshift- or openshift can be used to watch all namespaces that have openshift in it.
Note
The current implementation can monitor only one cluster from one host. It can be used to monitor multiple clusters provided multiple instances of Cerberus are launched on different hosts.
Note
The components especially the namespaces needs to be changed depending on the distribution i.e Kubernetes or OpenShift. The default specified in the config assumes that the distribution is OpenShift. A config file for Kubernetes is located at config/kubernetes_config.yaml
12.5 - Alerts
Cerberus consumes the metrics from Prometheus deployed on the cluster to report the alerts.
When provided the prometheus url and bearer token in the config, Cerberus reports the following alerts:
KubeAPILatencyHigh: alerts at the end of each iteration and warns if 99th percentile latency for given requests to the kube-apiserver is above 1 second. It is the official SLI/SLO defined for Kubernetes.
High number of etcd leader changes: alerts the user when an increase in etcd leader changes are observed on the cluster. Frequent elections may be a sign of insufficient resources, high network latency, or disruptions by other components and should be investigated.
NOTE: The prometheus url and bearer token are automatically picked from the cluster if the distribution is OpenShift since it’s the default metrics solution. In case of Kubernetes, they need to be provided in the config if prometheus is deployed.
12.6 - Node Problem Detector
node-problem-detector aims to make various node problems visible to the upstream layers in cluster management stack.
Installation
Please follow the instructions in the installation section to setup Node Problem Detector on Kubernetes. The following instructions are setting it up on OpenShift:
Create openshift-node-problem-detector namespace ns.yaml with oc create -f ns.yaml
Add cluster role with oc adm policy add-cluster-role-to-user system:node-problem-detector -z default -n openshift-node-problem-detector
Create the ConfigMap with oc create -f node-problem-detector-config.yaml
Create the DaemonSet with oc create -f node-problem-detector.yaml
Once installed you will see node-problem-detector pods in openshift-node-problem-detector namespace.
Now enable openshift-node-problem-detector in the config.yaml.
Cerberus just monitors KernelDeadlock condition provided by the node problem detector as it is system critical and can hinder node performance.
12.7 - Slack Integration
The user has the option to enable/disable the slack integration ( disabled by default ). To use the slack integration, the user has to first create an app and add a bot to it on slack. SLACK_API_TOKEN and SLACK_CHANNEL environment variables have to be set. SLACK_API_TOKEN refers to Bot User OAuth Access Token and SLACK_CHANNEL refers to the slack channel ID the user wishes to receive the notifications. Make sure the Slack Bot Token Scopes contains this permission [calls:read] [channels:read] [chat:write] [groups:read] [im:read] [mpim:read]
Reports when cerberus starts monitoring a cluster in the specified slack channel.
Reports the component failures in the slack channel.
A watcher can be assigned for each day of the week. The watcher of the day is tagged while reporting failures in the slack channel instead of everyone. (NOTE: Defining the watcher id’s is optional and when the watcher slack id’s are not defined, the slack_team_alias tag is used if it is set else no tag is used while reporting failures in the slack channel.)
Go or no-go signal
When the cerberus is configured to run in the daemon mode, it will continuously monitor the components specified, runs a simple http server at http://0.0.0.0:8080 and publishes the signal i.e True or False depending on the components status. The tools can consume the signal and act accordingly.
Failures in a time window
The failures in the past 1 hour can be retrieved in the json format by visiting http://0.0.0.0:8080/history.
The failures in a specific time window can be retrieved in the json format by visiting http://0.0.0.0:8080/history?loopback=.
The failures between two time timestamps, the failures of specific issues types and the failures related to specific components can be retrieved in the json format by visiting http://0.0.0.0:8080/analyze url. The filters have to be applied to scrape the failures accordingly.
Sample Slack Config
This is a snippet of how would your slack config could look like within your cerberus_config.yaml.
watcher_slack_ID:Monday:U1234ABCD # replace with your Slack ID from Profile-> More -> Copy Member IDTuesday:# Same or different ID can be used for remaining days depending on who you want to tagWednesday:Thursday:Friday:Saturday:Sunday:slack_team_alias:@group_or_team_id
In order to submit a change or a PR, please fork the project and follow instructions:
$ git clone http://github.com/<me>/cerberus
$ cd cerberus
$ git checkout -b <branch_name>
$ <make change>
$ git add <changes>
$ git commit -a
$ <insert good message>
$ git push
Fix Formatting
Cerberus uses pre-commit framework to maintain the code linting and python code styling.
The CI would run the pre-commit check on each pull request.
We encourage our contributors to follow the same pattern, while contributing to the code.
The pre-commit configuration file is present in the repository .pre-commit-config.yaml
It contains the different code styling and linting guide which we use for the application.
Following command can be used to run the pre-commit:
pre-commit run --all-files
If pre-commit is not installed in your system, it can be install with : pip install pre-commit
Squash Commits
If there are multiple commits, please rebase/squash multiple commits
before creating the PR by following:
$ git checkout <my-working-branch>
$ git rebase -i HEAD~<num_of_commits_to_merge>
-OR-
$ git rebase -i <commit_id_of_first_change_commit>
In the interactive rebase screen, set the first commit to pick and all others to squash (or whatever else you may need to do).
Push your rebased commits (you may need to force), then issue your PR.
$ git push origin <my-working-branch> --force
13 - Contribution Guidelines
How to contribute and get started
How to contribute
We’re excited to have you consider contributing to our chaos! Contributions are always appreciated.
Krkn
Contributing to Krkn
If you would like to contribute to Krkn, but are not sure exactly what to work on, you can find a number of open issues that are awaiting contributions in
issues.
Please start by discussing potential solutions and your proposed approach for the issue you plan to work on. We encourage you to gather feedback from maintainers and contributors and to have the issue assigned to you before opening a pull request with a solution.
Adding New Scenarios and Configurations
New Scenarios
We are always looking for new scenarios to make krkn better and more usable for our chaos community. If you have any ideas, please first open an issue to explain the new scenario you are wanting to add. We will review and respond with ideas of how to get started.
If adding a new scenario or tweaking the main config, be sure to add in updates into the CI to be sure the CI is up to date.
Please read this file for more information on updates.
Scenario Plugin Development
If you’re gearing up to develop new scenarios, take a moment to review our
Scenario Plugin API Documentation.
It’s the perfect starting point to tap into your chaotic creativity!
New Configuration to Scenarios
If you are currently using a scenario but want more configuration options, please open a github issue describing your use case and what fields and functionality you would like to see added. We will review the suggestion and give pointers on how to add the functionality. If you feel inclined, you can start working on the feature and we’ll help if you get stuck along the way.
Work in Progress PR’s
If you are working on a contribution in any capacity and would like to get a new set of eyes on your work, go ahead and open a PR with ‘[WIP]’ at the start of the title in your PR and tag the maintainers for review. We will review your changes and give you suggestions to keep you moving!
Office Hours
If you have any questions that you think could be better discussed on a meeting we have monthly office hours zoom link. Please add items to agenda before so we can best prepare to help you.
Good PR Checklist
Here’s a quick checklist for a good PR, more details below:
Reach out to us on slack if you ever have any questions or want to know how to get started. You can join the kubernetes Slack here and can join our Krkn channel
Edit the files with the code blocks you want to keep
Add and continue rebase
$ git add .
$ git rebase --continue
Might need to repeat steps 1-3 until you see Successfully rebased and updated refs/heads/<my-working-branch>.
Push your rebased commits (you may need to force), then issue your PR.
$ git push origin <my-working-branch> --force
Developer’s Certificate of Origin
Any contributions to Krkn must only contain code that can legally be contributed to Krkn, and which the Krkn project can distribute under its license.
Prior to contributing to Krkn please read the Developer’s Certificate of Origin and sign-off all commits with the –signoff option provided by git commit. For example:
git rebase HEAD~1 --signoff
git push origin <branch_name> --force
This option adds a Signed-off-by trailer at the end of the commit log message.
14 - Developers Guide
Developers Guide Overview
This document describes how to develop and add to Krkn. Before you start, it is recommended that you read the following documents first:
For any questions or further guidance, feel free to reach out to us on the
Kubernetes workspace in the #krkn channel.
We’re happy to assist. Now, release the Krkn!
Follow Contribution Guide
Once all you’re happy with your changes, follow the contribution guide on how to create your own branch and squash your commits
14.1 - Krkn-lib
Krkn-lib contains the base kubernetes python functions
krkn-lib
Krkn Chaos and resiliency testing tool Foundation Library
Contents
The Library contains Classes, Models and helper functions used in Kraken to interact with
Kubernetes, Openshift and other external APIS.
The goal of this library is to give to developers the building blocks to realize new Chaos
Scenarios and to increase the testability and the modularity of the Krkn codebase.
Packages
The library is subdivided in several Packages under src/krkn_lib
ocp: Openshift Integration
k8s: Kubernetes Integration
elastic: Collection of ElasticSearch functions for posting telemetry
prometheus: Collection of prometheus functions for collecting metrics and alerts
telemetry:
k8s: Kubernetes Telemetry collection and distribution
ocp: Openshift Telemetry collection and distribution
models: Krkn shared data models
k8s: Kubernetes objects model
krkn: Krkn base models
telemetry: Telemetry collection model
elastic: Elastic model for data
utils: common functions
Documentation and Available Functions
The Library documentation of available functions is here.
The documentation is automatically generated by Sphinx on top of the reStructuredText Docstring Format comments present in the code.
Installation
Git
Clone the repository
git clone https://github.com/krkn-chaos/krkn-lib
cd krkn-lib
Install the dependencies
Krkn lib uses poetry for its dependency management and packaging. To install the proper packages please use:
To see how you can configure and test your changes see testing changes
14.2 - Adding scenarios via plugin api
Scenario Plugin API:
This API enables seamless integration of Scenario Plugins for Krkn. Plugins are automatically
detected and loaded by the plugin loader, provided they extend the AbstractPluginScenario
abstract class, implement the required methods, and adhere to the specified naming conventions.
Plugin folder:
The plugin loader automatically loads plugins found in the krkn/scenario_plugins directory,
relative to the Krkn root folder. Each plugin must reside in its own directory and can consist
of one or more Python files. The entry point for each plugin is a Python class that extends the
AbstractPluginScenario abstract class and implements its required methods.
__init__ file
For the plugin to be properly found by the plugin api, there needs to be a init file in the base folder
This method represents the entry point of the plugin and the first method
that will be executed.
Parameters:
run_uuid:
the uuid of the chaos run generated by krkn for every single run.
scenario:
the config file of the scenario that is currently executed
krkn_config:
the full dictionary representation of the config.yaml
lib_telemetry
it is a composite object of all the krkn-lib objects and methods needed by a krkn plugin to run.
scenario_telemetry
the ScenarioTelemetry object of the scenario that is currently executed
Note
Helper functions for interactions in Krkn are part of krkn-lib. Please feel free to reuse and expand them as you see fit when adding a new scenario or expanding the capabilities of the current supported scenarios.
Return value:
Returns 0 if the scenario succeeds and 1 if it fails.
WARNING
All the exception must be handled inside the run method and not propagated.
get_scenario_types():
python def get_scenario_types(self) -> list[str]:
Indicates the scenario types specified in the config.yaml. For the plugin to be properly
loaded, recognized and executed, it must be implemented and must return one or more
strings matching scenario_type strings set in the config.
DANGER
Multiple strings can map to a singleScenarioPlugin but the same string cannot map to different plugins, an exception will be thrown for scenario_type redefinition.
INFO
The scenario_type strings must be unique across all plugins; otherwise, an exception will be thrown.
Naming conventions:
A key requirement for developing a plugin that will be properly loaded
by the plugin loader is following the established naming conventions.
These conventions are enforced to maintain a uniform and readable codebase,
making it easier to onboard new developers from the community.
plugin folder:
the plugin folder must be placed in the krkn/scenario_plugin folder starting from the krkn root folder
the plugin folder cannot contain the words
plugin
scenario
plugin file name and class name:
the plugin file containing the main plugin class must be named in snake case and must have the suffix _scenario_plugin:
example_scenario_plugin.py
the main plugin class must named in capital camel case and must have the suffix ScenarioPlugin :
ExampleScenarioPlugin
the file name must match the class name in the respective syntax:
the scenario type must be unique between all the scenarios.
logging:
If your new scenario does not adhere to the naming conventions, an error log will be generated in the Krkn standard output,
providing details about the issue:
If you’re trying to understand how the scenario types in the config.yaml are mapped to their corresponding plugins, this log will guide you! Each scenario plugin class mentioned can be found in the krkn/scenario_plugin folder simply convert the camel case notation and remove the ScenarioPlugin suffix from the class name e.g ShutDownScenarioPlugin class can be found in the krkn/scenario_plugin/shut_down folder.
ExampleScenarioPlugin
The ExampleScenarioPlugin class included in the tests folder can be used as a scaffolding for new plugins and it is considered
part of the documentation.
Adding CI tests
Depending on the complexity of the new scneario, it would be much appreciated if a CI test of the scenario would be added to our github action that gets run on each PR. To add a test:
i. 12: replace "application-outages" with your folder name
ii. 14: replace "application-outages" with your folder name
iii. 17: replace "application-outages" with your scenario name
iv. 18: replace description with a description of your new scenario
Add service/scenario to docker-compose.yaml file following syntax of other services
Point the dockerfile parameter in your docker-compose to the Dockerfile file in your new folder
Add the folder name to the list of scenarios in build.sh
If you added any main configuration variables or new sections be sure to update config.yaml.template
Similar to above, also add the default parameter values to env.sh
14.4 - Adding New Scenario to Krknctl
Adding Scenario to Krknctl
Adding a New Scenario to Krknctl
For krknctl to find the parameters of the scenario it uses a krknctl input json file. Once this file is added to krkn-hub, krknctl will be able to find it along with the details of how to run the scenario.
Add KrknCtl Input Json
This file adds every environment variable that is set up for krkn-hub to be defined as a flag to the krknctl cli command. There are a number of different type of variables that you can use, each with their own required fields. See below for an example of the different variable types
An example krknctl-input.json file can be found here
Enum Type Required Key/Values
{"name":"<name>","short_description":"<short-description>","description":"<longer-description>","variable":"<variable_name>",//this needs to match environment variable in krkn-hub
"type":"enum","allowed_values":"<value>,<value>","separator":",","default":"",// any default value
"required":"<true_or_false>"// true or false if required to set when running
}
String Type Required Key/Values
{"name":"<name>","short_description":"<short-description>","description":"<longer-description>","variable":"<variable_name>",//this needs to match environment variable in krkn-hub
"type":"string","default":"",// any default value
"required":"<true_or_false>"// true or false if required to set when running
}
Number Type Required Key/Values
{"name":"<name>","short_description":"<short-description>","description":"<longer-description>","variable":"<variable_name>",//this needs to match environment variable in krkn-hub
"type":"number",// options: string, number, file, file64
"default":"",// any default value
"required":"<true_or_false>"// true or false if required to set when running
}
File Type Required Key/Values
{"name":"<name>","short_description":"<short-description>","description":"<longer-description>","variable":"<variable_name>",//this needs to match environment variable in krkn-hub
"type":"file","mount_path":"/home/krkn/<file_loc>",// file location to mount to, using /home/krkn as the base has correct read/write locations
"required":"<true_or_false>"// true or false if required to set when running
}
File Base 64 Type Required Key/Values
{"name":"<name>","short_description":"<short-description>","description":"<longer-description>","variable":"<variable_name>",//this needs to match environment variable in krkn-hub
"type":"file_base64","required":"<true_or_false>"// true or false if required to set when running
}
14.5 - Adding to Krkn Test Suite
This guide covers how to add both unit tests and functional tests to the krkn project. Tests are essential for ensuring code quality and preventing regressions.
Unit Tests
Unit tests in krkn are located in the tests/ directory and use Python’s unittest framework with comprehensive mocking to avoid requiring external dependencies like cloud providers or Kubernetes clusters.
Creating a Unit Test
1. File Location and Naming
Place your test file in the tests/ directory with the naming pattern test_<feature>.py:
#!/usr/bin/env python3"""
Test suite for <Feature Name>
IMPORTANT: These tests use comprehensive mocking and do NOT require any external
infrastructure, cloud credentials, or Kubernetes cluster. All API calls are mocked.
Test Coverage:
- Feature 1: Description
- Feature 2: Description
Usage:
# Run all tests
python -m unittest tests.test_<your_feature> -v
# Run with coverage
python -m coverage run -a -m unittest tests/test_<your_feature>.py -v
Assisted By: Claude Code
"""importunittestfromunittest.mockimportMagicMock,patch,Mock# Import the classes you're testingfromkrkn.scenario_plugins.<module>importYourClassclassTestYourFeature(unittest.TestCase):"""Test cases for YourClass"""defsetUp(self):"""Set up test fixtures before each test"""# Mock environment variables if neededself.env_patcher=patch.dict('os.environ',{'API_KEY':'test-api-key','API_URL':'https://test.example.com'})self.env_patcher.start()# Mock external dependenciesself.mock_client=MagicMock()# Create instance to testself.instance=YourClass()deftearDown(self):"""Clean up after each test"""self.env_patcher.stop()deftest_success_scenario(self):"""Test successful operation"""# Arrange: Set up test dataexpected_result="success"# Act: Call the method being testedresult=self.instance.your_method()# Assert: Verify the resultself.assertEqual(result,expected_result)deftest_failure_scenario(self):"""Test failure handling"""# Arrange: Set up failure conditionself.mock_client.some_method.side_effect=Exception("API Error")# Act & Assert: Verify exception is handledwithself.assertRaises(Exception):self.instance.your_method()if__name__=='__main__':unittest.main()
3. Best Practices for Unit Tests
Use Comprehensive Mocking: Mock all external dependencies (cloud APIs, Kubernetes, file I/O)
Add IMPORTANT Note: Include a note in the docstring that tests don’t require credentials
Document Test Coverage: List what scenarios each test covers
Organize Tests by Category: Use section comments like # ==================== Core Tests ====================
Test Edge Cases: Include tests for timeouts, missing parameters, API exceptions
Use Descriptive Names: Test names should clearly describe what they test
4. Running Unit Tests
# Run all unit testspython -m unittest discover -s tests -v
# Run specific test filepython -m unittest tests.test_your_feature -v
# Run with coveragepython -m coverage run -a -m unittest discover -s tests -v
python -m coverage report
Functional Tests
Functional tests in krkn are integration tests that run complete chaos scenarios against a real Kubernetes cluster (typically KinD in CI). They are located in the CI/tests/ directory.
Understanding the Functional Test Structure
CI/
├── run.sh # Main test runner
├── run_test.sh # Individual test executor
├── config/
│ ├── common_test_config.yaml # Base configuration template
│ └── <scenario>_config.yaml # Generated configs per scenario
├── tests/
│ ├── common.sh # Common helper functions
│ ├── functional_tests # List of tests to run
│ └── test_*.sh # Individual test scripts
└── out/
└── <test_name>.out # Test output logs
Adding a New Functional Test
Step 1: Create the Test Script
Create a new test script in CI/tests/ following the naming pattern test_<scenario>.sh:
#!/bin/bash
set -xeEo pipefail
source CI/tests/common.sh
trap error ERR
trap finish EXIT
function functional_test_<your_scenario> {# Set environment variables for the scenarioexportscenario_type="<scenario_type>"exportscenario_file="scenarios/kind/<scenario_file>.yml"exportpost_config=""# Generate config from template with variable substitution envsubst < CI/config/common_test_config.yaml > CI/config/<your_scenario>_config.yaml
# Optional: View the generated config cat CI/config/<your_scenario>_config.yaml
# Run kraken with coverage python3 -m coverage run -a run_kraken.py -c CI/config/<your_scenario>_config.yaml
# Success messageecho"<Your Scenario> scenario test: Success"# Optional: Verify expected state date
kubectl get pods -n <namespace> -l <label>=<value> -o yaml
}# Execute the test functionfunctional_test_<your_scenario>
Step 2: Create or Reference Scenario File
Ensure your scenario YAML file exists in scenarios/kind/:
This page gives details about how you can get a kind cluster configured to be able to run on krkn-lib (the lowest level of krkn-chaos repos) up through krknctl (our easiest way to run and highest level repo)
poetry run python3 -m coverage run -a -m unittest discover -v src/krkn_lib/tests/
Adding tests
Be sure that if you are adding any new functions or functionality you are adding unit tests for it. We want to keep above an 80% coverage in this repo since its our base functionality
Testing Changes in Krkn
Unit Tests
Krkn unit tests are located in the tests/ directory and use Python’s unittest framework with comprehensive mocking. IMPORTANT: These tests do NOT require any external infrastructure, cloud credentials, or Kubernetes cluster - all dependencies are mocked.
Prerequisites
Install krkn dependencies in a virtual environment:
After running tests with coverage, generate an HTML report:
# Generate HTML coverage reportpython -m coverage html
# View the reportopen htmlcov/index.html # macOSxdg-open htmlcov/index.html # Linux
Or view a text summary:
python -m coverage report
Example output:
Name Stmts Miss Cover
---------------------------------------------------------------------------------
krkn/scenario_plugins/kubevirt_vm_outage/... 215 12 94%
krkn/scenario_plugins/node_actions/ibmcloud_node_scenarios.py 185 8 96%
---------------------------------------------------------------------------------
TOTAL 2847 156 95%
Test Output
Unit test output shows:
Test names and descriptions
Pass/fail status for each test
Execution time
Any assertion failures or errors
Example output:
test_successful_injection_and_recovery (tests.test_kubevirt_vm_outage.TestKubevirtVmOutageScenarioPlugin)
Test successful deletion and recovery of a VMI using detailed mocking ... ok
test_injection_failure (tests.test_kubevirt_vm_outage.TestKubevirtVmOutageScenarioPlugin)
Test failure during VMI deletion ... ok
test_validation_failure (tests.test_kubevirt_vm_outage.TestKubevirtVmOutageScenarioPlugin)
Test validation failure when KubeVirt is not installed ... ok
----------------------------------------------------------------------
Ran 30 tests in 1.234s
OK
Adding Unit Tests
When adding new functionality, always add corresponding unit tests. See the Adding Tests to Krkn guide for detailed instructions.
Key requirements:
Use comprehensive mocking (no external dependencies)
Add “IMPORTANT” note in docstring about no credentials needed
Test success paths, failure paths, edge cases, and exceptions
Organize tests into logical sections
Aim for >80% code coverage
Functional Tests (if able to run scenario on kind cluster)
Configuring test Cluster
After creating a kind cluster with the steps above, create these test pods on your cluster
Be sure that if you are adding any new scenario you are adding tests for it based on a 5 (3 master, 2 worker) node kind cluster. See more details on how to add functional tests here
The tests live here
Testing Changes for Krkn-hub
Install Podman/Docker Compose
You can use either podman-compose or docker-compose for this step
NOTE: Podman might not work on Mac’s
pip3 install docker-compose
OR
To get latest podman-compose features we need, use this installation command
docker run -d -v <kube_config_path>:/root/.kube/config:Z quay.io/<username>/krkn-hub:<scenario_type>
OR
podman run -d -v <kube_config_path>:/root/.kube/config:Z quay.io/<username>/krkn-hub:<scenario_type>
See krkn-hub documentation for each scenario to see all possible variables to use
Testing Changes in Krknctl
Once you’ve created a krknctl-input.json file using the steps here, you’ll want to test those changes using the below steps. You will need a either podman or docker installed as well as a quay account.
Build and Push to personal Quay
First you will build your changes of krkn-hub and push changes to your own quay repository for testing
Run Krknctl with Personal Image
Once you have your images in quay, you are all set to configure krknctl to look for these new images. You’ll edit the config file of krknctl found here and edit the quay_org to be set to your quay username
With these updates to your config, you’ll build your personal krknctl binary and you’ll be all set to start testing your new scenario and config options.
If any krknctl code changes are required, you’ll have to make changes and rebuild the the krknctl binary each time to test as well
15 - Performance Dashboards
Deployable grafana to help analyze cluster performance during chaos
Performance dashboards
Krkn-chaos repository collection gives you a way to install a grafana on the cluster with dashboards loaded to help with monitoring the cluster for things like resource usage to find the outliers, API stats, Etcd health, Critical alerts etc. As well as specific metrics related to your krkn runs if elasticsearch is enabled.
git clone https://github.com/krkn-chaos/visualize
cd krkn-visualize
./deploy.sh
OR
./deploy.sh -c oc # openshift installation
The dashboards can be edited/modified to include your queries of interest by logging in as the admin user. New dasbhoards can be imported using the import script and following directions defined here
cd krkn-visualize
./import.sh -i ../rendered/<folder>/<dashboard_name>.json
NOTE: The dashboards leverage Prometheus for scraping the metrics off of the cluster and supports OpenShift automatically, but the user would need to install Prometheus on a kuberentes cluster before dashboards are deployed. Once Prometheus is setup on the cluster it’ll leverage route objects to expose the grafana dashboards externally
If you don’t have elasticsearch or prometheus installed on your cluster, you can use helm to help you deploy these services. See these helpful commands on how to install them
Krkn Dashboards
Pod Scenarios
Node Scenarios
OpenShift Dashboards
API Performance
Etcd
General OCP Performance
OVN
and Krkn Dashboards
K8s Dashboards
General K8s Performance
and Krkn Dashboards
16 - Chaos Recommendation Tool
Krkn scenario recommender tool
This tool, designed for Kraken, operates through the command line and offers recommendations for chaos testing. It suggests probable chaos test cases that can disrupt application services by analyzing their behavior and assessing their susceptibility to specific fault types.
This tool profiles an application and gathers telemetry data such as CPU, Memory, and Network usage, analyzing it to suggest probable chaos scenarios. For optimal results, it is recommended to activate the utility while the application is under load.
Pre-requisites
Openshift Or Kubernetes Environment where the application is hosted
Access to the metrics via the exposed Prometheus endpoint
Follow the prompts to provide the required information.
Configuration
To run the recommender with a config file specify the config file path with the -c argument.
You can customize the default values by editing the recommender_config.yaml file. The configuration file contains the following options:
application: Specify the application name.
namespaces: Specify the namespaces names (separated by coma or space). If you want to profile
labels: Specify the labels (not used).
kubeconfig: Specify the location of the kubeconfig file (not used).
prometheus_endpoint: Specify the prometheus endpoint (must).
auth_token: Auth token to connect to prometheus endpoint (must).
scrape_duration: For how long data should be fetched, e.g., ‘1m’ (must).
chaos_library: “kraken” (currently it only supports kraken).
json_output_file: True or False (by default False).
json_output_folder_path: Specify folder path where output should be saved. If empty the default path is used.
chaos_tests: (for output purpose only do not change if not needed)
GENERAL: list of general purpose tests available in Krkn
MEM: list of memory related tests available in Krkn
NETWORK: list of network related tests available in Krkn
CPU: list of memory related tests available in Krkn
threshold: Specify the threshold to use for comparison and identifying outliers
cpu_threshold: Specify the cpu threshold to compare with the cpu limits set on the pods and identify outliers
mem_threshold: Specify the memory threshold to compare with the memory limits set on the pods and identify outliers
TIP: to collect prometheus endpoint and token from your OpenShift cluster you can run the following commands:
prometheus_url=$(kubectl get routes -n openshift-monitoring prometheus-k8s --no-headers | awk '{print $2}')#TO USE YOUR CURRENT SESSION TOKENtoken=$(oc whoami -t)#TO CREATE A NEW TOKENtoken=$(kubectl create token -n openshift-monitoring prometheus-k8s --duration=6h || oc sa new-token -n openshift-monitoring prometheus-k8s)
You can also provide the input values through command-line arguments launching the recommender with -o option:
-o, --options Evaluate command line options
-a APPLICATION, --application APPLICATION
Kubernetes application name
-n NAMESPACES, --namespaces NAMESPACE
Kubernetes application namespaces separated by space
-l LABELS, --labels LABELS
Kubernetes application labels
-p PROMETHEUS_ENDPOINT, --prometheus-endpoint PROMETHEUS_ENDPOINT
Prometheus endpoint URI
-k KUBECONFIG, --kubeconfig KUBECONFIG
Kubeconfig path
-t TOKEN, --token TOKEN
Kubernetes authentication token
-s SCRAPE_DURATION, --scrape-duration SCRAPE_DURATION
Prometheus scrape duration
-i LIBRARY, --library LIBRARY
Chaos library
-L LOG_LEVEL, --log-level LOG_LEVEL
log level (DEBUG, INFO, WARNING, ERROR, CRITICAL
-J [FOLDER_PATH], --json-output-file [FOLDER_PATH] Create output file, the path to the folder can be specified, if not specified the default folder is used.
-M MEM [MEM ...], --MEM MEM [MEM ...] Memory related chaos tests (space separated list) -C CPU [CPU ...], --CPU CPU [CPU ...] CPU related chaos tests (space separated list) -N NETWORK [NETWORK ...], --NETWORK NETWORK [NETWORK ...] Network related chaos tests (space separated list) -G GENERIC [GENERIC ...], --GENERIC GENERIC [GENERIC ...] Memory related chaos tests (space separated list) --threshold THRESHOLD
Threshold
--cpu_threshold CPU_THRESHOLD
CPU threshold to compare with the cpu limits
--mem_threshold MEM_THRESHOLD
Memory threshold to compare with the memory limits
If you provide the input values through command-line arguments, the corresponding config file inputs would be ignored.
Podman & Docker image
To run the recommender image please visit the krkn-hub for further infos.
How it works
After obtaining telemetry data, sourced either locally or from Prometheus, the tool conducts a comprehensive data analysis to detect anomalies. Employing the Z-score method and heatmaps, it identifies outliers by evaluating CPU, memory, and network usage against established limits. Services with Z-scores surpassing a specified threshold are categorized as outliers. This categorization classifies services as network, CPU, or memory-sensitive, consequently leading to the recommendation of relevant test cases.
Customizing Thresholds and Options
You can customize the thresholds and options used for data analysis and identifying the outliers by setting the threshold, cpu_threshold and mem_threshold parameters in the config.
Additional Files
recommender_config.yaml: The configuration file containing default values for application, namespace, labels, and kubeconfig.
Happy Chaos!
17 - Krkn Debugging Tips
Common helpful tips if you hit issues running krkn
Common Debugging Issues
SSL Certification
Error
...
urllib3.exceptions.MaxRetryError: HTTPSConnectionPool(host='api.***.io', port=6443): Max retries exceeded with url: /apis/config.openshift.io/v1/clusterversions (Caused by SSLError(SSLCertVerificationError(1, '[SSL: CERTIFICATE_VERIFY_FAILED] certificate verify failed: self-signed certificate in certificate chain (_ssl.c:1147)')))
Fix
The user needs to have tls verification by logging in using
No. Krkn is designed to measure application or cluster resilience injecting controlled resource disruptions, but it should not be considered a security provider.
Known Weakness. Creation of a security-insights.yml should be added to the roadmap.
Overview
krkn is a chaos and resiliency testing tool for Kubernetes. Krkn injects deliberate failures into Kubernetes clusters to check if it is resilient to turbulent conditions.
Background
There are a couple of false assumptions that users might have when operating and running their applications in distributed systems:
The network is reliable
There is zero latency
Bandwidth is infinite
The network is secure
Topology never changes
The network is homogeneous
Consistent resource usage with no spikes
All shared resources are available from all places
Various assumptions led to a number of outages in production environments in the past. The services suffered from poor performance or were inaccessible to the customers, leading to missing Service Level Agreement uptime promises, revenue loss, and a degradation in the perceived reliability of said services.
Actors
Krkn Is the project source repository, is the python project containing the application sources, all the scenarios plugins and the configuration files
krkn-lib Is the main project library repository containing all the classes, the data models and the helper functions used by the krkn scenarios
krkn-hub Hosts container images and wrapper for running scenarios supported by Krkn, a chaos testing tool for Kubernetes clusters to ensure it is resilient to failures. All we need to do is run the containers with the respective environment variables defined as supported by the scenarios without having to maintain and tweak files.
krknctl Krknctl is a tool designed to run and orchestrate krkn chaos scenarios utilizing container images from the krkn-hub. Its primary objective is to streamline the usage of krkn by providing features like command auto-completion, input validation, scenario descriptions and detailed instructions and much more, effectively abstracting the complexities of the container environment.
Actions
The Krkn Core orchestrates chaos scenarios outside from the cluster interacting with cluster APIs and collecting metrics
Krkn-lib methods and classes are used by the Krkn core to execute actions and interact with cluster APIs.
Krkn-hub scripts and CI/CD pipelines build the core Krkn components, including Krkn, krkn-lib, and init scripts. These are packaged with all necessary dependencies into multiple container images, each tagged for a specific scenario. The init scripts then translate the container’s environment variables into a valid Krkn configuration, enabling scenarios to run without any manual installation of dependencies.
Krknctl is a powerful CLI for managing chaos scenarios. It can list, inspect, and run all available scenario tags by fetching their input metadata directly from the container registry. The tool simplifies execution by translating environment variables into command-line arguments and validates all input using a robust typing protocol defined within each image’s manifest.Beyond basic scenario management, Krknctl can run multiple Krkn instances in both parallel and serial modes. This capability allows you to create and orchestrate powerful, complex chaos conditions.
Goals
Test coverage
The project’s testing strategy is multi-layered, covering individual primitives, the core application, and the command-line tool.
Krkn-libKrkn-lib was created by extracting core primitives from the main Krkn codebase, allowing them to be tested individually. It has a dedicated testing pipeline with over 80% coverage.
Krkn coreThe Krkn core functionality is validated through a suite of functional test scripts that execute the krkn binary and collect test results.
KrknctlThe Krknctl command-line tool has a dedicated test suite with approximately 50% coverage. To qualify Krknctl for a stable release, our internal goal is to raise its test coverage to a minimum of 80%.
Dependency check
KrknThe project dependencies are currently monitored by Snyk and github dependabot
krkn-libThe project dependencies are currently monitored by github dependabot
krknctlThe project dependencies are currently monitored by github dependabot
Static code analysis
Krknctl
Krknctl code is currently tested in the CI pipeline with staticcheck and gosec
KrknKnown Weakness. Krkn static code analysis should be added to the roadmap.
Krkn-libKnown Weakness. krkn-lib static code analysis should be added to the roadmap.
Container image scanning
Our base image on top of which all the tags are build is scanned on the building phase by Snyk CLI in the CI pipeline.
Input validation protocol
Python’s flexible typing has made user input validation a challenge for the Krkn core. To solve this, we’ve established a new validation protocol between the Krknctl CLI and our container images. By making Krknctl the main entry point for running Krkn, we can now rely on it to ensure all user input is robustly validated.
Non-Goals
Target systems integrity
Krkn includes a rollback system designed to restore a cluster to its original state. However, due to the highly disruptive nature of certain scenarios, particularly those targeting critical subsystems, it may lead to non-recoverable conditions. For this reason, maintaining the integrity and security of the target system is a non-goal for the project.
Self-assessment Use
This self-assessment was created by the Krkn team to perform an internal security analysis of the project. It is not intended to serve as a security audit of the Krkn development team, nor does it function as an independent assessment or attestation of the team’s security health.
This document provides Krkn users with an initial understanding of the project’s security posture. It serves as a guide to existing security documentation, outlines the Krkn team’s security plans, and offers a general overview of the team’s security practices for both development and project maintenance.
Finally, the document gives Krkn maintainers and stakeholders additional context. This information is intended to help inform the roadmap creation process, ensuring that security and feature improvements can be prioritized accordingly.
Security functions and features
Component
Applicability
Description of Importance
Krkn Rollback System
Critical
The Rollback System component enables Krkn to restore targeted Kubernetes objects or subsystems to their original state. This is a critical feature that allows for an asynchronous rollback persisting all changes to the filesystem before the chaos scenario is executed, which is necessary when unpredictable conditions interrupt a scenario and prevent the normal restoration process from completing.
krknctl Input Validation
Critical
This system ensures that all user-provided inputs are valid, preventing scenario execution failures and a wide range of unexpected behaviors that could result from malformed data.
Project Compliance
Krkn does not currently adhere to any compliance standards.
Future State
To address the need for certification, we are absolutely open to considering it. However, we have not yet encountered the necessity to adhere to a specific standard in any production environment where Krkn is currently deployed.
Secure Development Practices
Despite being a sandbox project, Krkn is committed to secure development practices in all our repositories. Our approach, which aligns with industry standards, is detailed in the sections below.
Branch protection on the default (main) branch:
Require signed commits
Require a pull request before merging
Require approvals: 1
Dismiss stale pull request approvals when new commits are pushed
Require review from Code Owners
Require approval of the most recent reviewable push
Require conversation resolution before merging
Require status checks to pass before merging
Require branches to be up to date before merging
Communication Channels
Krkn’s communication channels are structured to facilitate both internal collaboration and public engagement.
Internal Communication
Krkn maintainers and contributors primarily communicate through the public Slack channel (#krkn on kubernetes.slack.com) and direct messages.
Public Communication
Inbound: We welcome incoming messages and feedback through GitHub Issues and the public Slack channel.
Outbound: We communicate project news and updates to our users primarily via documentation and release notes. Our public Slack channel is used for secondary announcements.
Security Issue Resolution
The Krkn security policy is maintained in the SECURITY.md file and can be quickly found through the GitHub Security Overview.
Anyone can submit a report by using the dedicated reporting form within the GitHub repository. Once a report is received, a maintainer will collaborate directly with the reporter via the Security Advisory until the issue is resolved.
Incident Response
When a vulnerability is reported, the maintainer team will first collaborate to determine its validity and criticality. Based on this assessment, a fix will be triaged and a patch will be issued in a timely manner.
Patches will be applied to all versions currently supported by the project’s security policy. Information about the fix will then be disseminated to the community through all appropriate outbound channels as quickly as circumstances allow.
Appendix
Known Issues Over Time
Known issues are currently tracked in the project roadmap. There are currently some security issues that need to be addressed by two downstream dependencies of the base image (Openshift CLI oc, python docker sdk)
ManagedCluster scenarios leverage ManifestWorks to inject faults into the ManagedClusters.
The following ManagedCluster chaos scenarios are supported:
managedcluster_start_scenario: Scenario to start the ManagedCluster instance.
managedcluster_stop_scenario: Scenario to stop the ManagedCluster instance.
managedcluster_stop_start_scenario: Scenario to stop and then start the ManagedCluster instance.
start_klusterlet_scenario: Scenario to start the klusterlet of the ManagedCluster instance.
stop_klusterlet_scenario: Scenario to stop the klusterlet of the ManagedCluster instance.
stop_start_klusterlet_scenario: Scenario to stop and start the klusterlet of the ManagedCluster instance.
ManagedCluster scenarios can be injected by placing the ManagedCluster scenarios config files under managedcluster_scenarios option in the Kraken config. Refer to managedcluster_scenarios_example config file.
managedcluster_scenarios:
  - actions:                                                        # ManagedCluster chaos scenarios to be injected
    - managedcluster_stop_start_scenario
    managedcluster_name: cluster1                                   # ManagedCluster on which scenario has to be injected; can set multiple names separated by comma
    # label_selector:                                               # When managedcluster_name is not specified, a ManagedCluster with matching label_selector is selected for ManagedCluster chaos scenario injection
    instance_count: 1                                               # Number of managedcluster to perform action/select that match the label selector
    runs: 1                                                         # Number of times to inject each scenario under actions (will perform on same ManagedCluster each time)
    timeout: 420                                                    # Duration to wait for completion of ManagedCluster scenario injection
                                                                    # For OCM to detect a ManagedCluster as unavailable, have to wait 5*leaseDurationSeconds
                                                                    # (default leaseDurationSeconds = 60 sec)
  - actions:
    - stop_start_klusterlet_scenario
    managedcluster_name: cluster1
    # label_selector:
    instance_count: 1
    runs: 1
    timeout: 60
20 - Chaos Testing Guide
Chaos testing guide with strategies and methodologies
Failures in production are costly. To help mitigate risk to service health, consider the following strategies and approaches to service testing:
Be proactive vs reactive. We have different types of test suites in place - unit, integration and end-to-end - that help expose bugs in code in a controlled environment. Through implementation of a chaos engineering strategy, we can discover potential causes of service degradation. We need to understand the systems’ behavior under unpredictable conditions in order to find the areas to harden, and use performance data points to size the clusters to handle failures in order to keep downtime to a minimum.
Test the resiliency of a system under turbulent conditions by running tests that are designed to disrupt while monitoring the systems adaptability and performance:
Establish and define your steady state and metrics - understand the behavior and performance under stable conditions and define the metrics that will be used to evaluate the system’s behavior. Then decide on acceptable outcomes before injecting chaos.
Analyze the statuses and metrics of all components during the chaos test runs.
Improve the areas that are not resilient and performant by comparing the key metrics and Service Level Objectives (SLOs) to the stable conditions before the chaos.
For example: evaluating the API server latency or application uptime to see if the key performance indicators and service level indicators are still within acceptable limits.
Best Practices
Now that we understand the test methodology, let us take a look at the best practices for an Kubernetes cluster. On that platform there are user applications and cluster workloads that need to be designed for stability and to provide the best user experience possible:
Alerts with appropriate severity should get fired.
Alerts are key to identify when a component starts degrading, and can help focus the investigation effort on affected system components.
Alerts should have proper severity, description, notification policy, escalation policy, and SOP in order to reduce MTTR for responding SRE or Ops resources.
Detailed information on the alerts consistency can be found here.
Minimal performance impact - Network, CPU, Memory, Disk, Throughput etc.
The system, as well as the applications, should be designed to have minimal performance impact during disruptions to ensure stability and also to avoid hogging resources that other applications can use.
We want to look at this in terms of CPU, Memory, Disk, Throughput, Network etc.
We want to look at this in terms of CPU, Memory, Disk, Throughput, Network etc.
Appropriate CPU/Memory limits set to avoid performance throttling and OOM kills.
There might be rogue applications hogging resources ( CPU/Memory ) on the nodes which might lead to applications underperforming or worse getting OOM killed. It is important to ensure that applications and system components have reserved resources for the kube-scheduler to take into consideration in order to keep them performing at the expected levels.
Services dependent on the system under test need to handle the failure gracefully to avoid performance degradation and downtime - appropriate timeouts.
In a distributed system, services deployed coordinate with each other and might have external dependencies. Each of the services deployed as a deployment, pod, or container, need to handle the downtime of other dependent services gracefully instead of crashing due to not having appropriate timeouts, fallback logic etc.
Proper node sizing to avoid cascading failures and ensure cluster stability especially when the cluster is large and dense
The platform needs to be sized taking into account the resource usage spikes that might occur during chaotic events. For example, if one of the main nodes goes down, the other two main nodes need to have enough resources to handle the load. The resource usage depends on the load or number of objects that are running being managed by the Control Plane ( Api Server, Etcd, Controller and Scheduler ). As such, it’s critical to test such conditions, understand the behavior, and leverage the data to size the platform appropriately. This can help keep the applications stable during unplanned events without the control plane undergoing cascading failures which can potentially bring down the entire cluster.
Proper node sizing to avoid application failures and maintain stability.
An application pod might use more resources during reinitialization after a crash, so it is important to take that into account for sizing the nodes in the cluster to accommodate it. For example, monitoring solutions like Prometheus need high amounts of memory to replay the write ahead log ( WAL ) when it restarts. As such, it’s critical to test such conditions, understand the behavior, and leverage the data to size the platform appropriately. This can help keep the application stable during unplanned events without undergoing degradation in performance or even worse hog the resources on the node which can impact other applications and system pods.
Minimal initialization time and fast recovery logic.
The controller watching the component should recognize a failure as soon as possible. The component needs to have minimal initialization time to avoid extended downtime or overloading the replicas if it is a highly available configuration. The cause of failure can be because of issues with the infrastructure on top of which it is running, application failures, or because of service failures that it depends on.
High Availability deployment strategy.
There should be multiple replicas ( both Kubernetes and application control planes ) running preferably in different availability zones to survive outages while still serving the user/system requests. Avoid single points of failure.
Backed by persistent storage
It is important to have the system/application backed by persistent storage. This is especially important in cases where the application is a database or a stateful application given that a node, pod, or container failure will wipe off the data.
There should be fallback routes to the backend in case of using CDN, for example, Akamai in case of console.redhat.com - a managed service deployed on top of Kubernetes dedicated:
Content delivery networks (CDNs) are commonly used to host resources such as images, JavaScript files, and CSS. The average web page is nearly 2 MB in size, and offloading heavy resources to third-parties is extremely effective for reducing backend server traffic and latency. However, this makes each CDN an additional point of failure for every site that relies on it. If the CDN fails, its customers could also fail.
To test how the application reacts to failures, drop all network traffic between the system and CDN. The application should still serve the content to the user irrespective of the failure.
Appropriate caching and Content Delivery Network should be enabled to be performant and usable when there is a latency on the client side.
Not every user or machine has access to unlimited bandwidth, there might be a delay on the user side ( client ) to access the API’s due to limited bandwidth, throttling or latency depending on the geographic location. It is important to inject latency between the client and API calls to understand the behavior and optimize things including caching wherever possible, using CDN’s or opting for different protocols like HTTP/2 or HTTP/3 vs HTTP.
Ensure Disruption Budgets are enabled for your critical applications
Protect your application during disruptions by setting a pod disruption budget to avoid downtime. For instance, etcd, zookeeper or similar applications need at least 2 replicas to maintain quorum. This can be ensured by setting PDB maxUnavailable to 1.
Enable Machine Health Checks to remediate node failures to avoid extended application and critical components downtime
Deploy machine health checks with appropriate conditions to remediate unhealthy nodes for the workloads to have enough capacity to run without downtime
Tooling
Now that we looked at the best practices, In this section, we will go through how Kraken - a chaos testing framework can help test the resilience of Kubernetes and make sure the applications and services are following the best practices.
Cluster recovery checks, metrics evaluation and pass/fail criteria
Most of the scenarios have built in checks to verify if the targeted component recovered from the failure after the specified duration of time but there might be cases where other components might have an impact because of a certain failure and it’s extremely important to make sure that the system/application is healthy as a whole post chaos. This is exactly where Cerberus comes to the rescue.
If the monitoring tool, cerberus is enabled it will consume the signal and continue running chaos or not based on that signal.
Apart from checking the recovery and cluster health status, it’s equally important to evaluate the performance metrics like latency, resource usage spikes, throughput, etcd health like disk fsync, leader elections etc. To help with this, Kraken has a way to evaluate promql expressions from the incluster prometheus and set the exit status to 0 or 1 based on the severity set for each of the query. Details on how to use this feature can be found here.
The overall pass or fail of kraken is based on the recovery of the specific component (within a certain amount of time), the cerberus health signal which tracks the health of the entire cluster and metrics evaluation from incluster prometheus.
Scenarios
Let us take a look at how to run the chaos scenarios on your Kubernetes clusters using Kraken-hub - a lightweight wrapper around Kraken to ease the runs by providing the ability to run them by just running container images using podman with parameters set as environment variables. This eliminates the need to carry around and edit configuration files and makes it easy for any CI framework integration. Here are the scenarios supported:
Disrupts Kubernetes/Kubernetes and applications deployed as containers running as part of a pod(s) using a specified kill signal to mimic failures:
Helps understand the impact and recovery timing when the program/process running in the containers are disrupted - hangs, paused, killed etc., using various kill signals, i.e. SIGHUP, SIGTERM, SIGKILL etc.
Disrupts nodes as part of the cluster infrastructure by talking to the cloud API. AWS, Azure, GCP, OpenStack and Baremetal are the supported platforms as of now. Possible disruptions include:
Creates outage of availability zone(s) in a targeted region in the public cloud where the Kubernetes cluster is running by tweaking the network acl of the zone to simulate the failure, and that in turn will stop both ingress and egress traffic from all nodes in a particular zone for the specified duration and reverts it back to the previous state.
Helps understand the impact on both Kubernetes/Kubernetes control plane as well as applications and services running on the worker nodes in that zone.
Currently, only set up for AWS cloud platform: 1 VPC and multiples subnets within the VPC can be specified.
Scenario to block the traffic ( Ingress/Egress ) of an application matching the labels for the specified duration of time to understand the behavior of the service/other services which depend on it during the downtime.
Helps understand how the dependent services react to the unavailability.
This scenario imitates a power outage by shutting down of the entire cluster for a specified duration of time, then restarts all the nodes after the specified time and checks the health of the cluster.
There are various use cases in the customer environments. For example, when some of the clusters are shutdown in cases where the applications are not needed to run in a particular time/season in order to save costs.
The nodes are stopped in parallel to mimic a power outage i.e., pulling off the plug
Helps understand if the application/system components have reserved resources to not get disrupted because of rogue applications, or get performance throttled.
Fills up the persistent volumes, up to a given percentage, used by the pod for the specified duration.
Helps understand how an application deals when it is no longer able to write data to the disk. For example, kafka’s behavior when it is not able to commit data to the disk.
Scenario to block the traffic ( Ingress/Egress ) of a pod matching the labels for the specified duration of time to understand the behavior of the service/other services which depend on it during downtime. This helps with planning the requirements accordingly, be it improving the timeouts or tweaking the alerts etc.
With the current network policies, it is not possible to explicitly block ports which are enabled by allowed network policy rule. This chaos scenario addresses this issue by using OVS flow rules to block ports related to the pod. It supports OpenShiftSDN and OVNKubernetes based networks.
Using this type of scenario configuration one is able to delete crucial objects in a specific namespace, or a namespace matching a certain regex string.
Service Hijacking Scenarios aim to simulate fake HTTP responses from a workload targeted by a Service already deployed in the cluster. This scenario is executed by deploying a custom-made web service and modifying the target Service selector to direct traffic to this web service for a specified duration.
Test Environment Recommendations - how and where to run chaos tests
Let us take a look at few recommendations on how and where to run the chaos tests:
Run the chaos tests continuously in your test pipelines:
Software, systems, and infrastructure does change – and the condition/health of each can change pretty rapidly. A good place to run tests is in your CI/CD pipeline running on a regular cadence.
Run the chaos tests manually to learn from the system:
When running a Chaos scenario or Fault tests, it is more important to understand how the system responds and reacts, rather than mark the execution as pass or fail.
It is important to define the scope of the test before the execution to avoid some issues from masking others.
Run the chaos tests in production environments or mimic the load in staging environments:
As scary as a thought about testing in production is, production is the environment that users are in and traffic spikes/load are real. To fully test the robustness/resilience of a production system, running Chaos Engineering experiments in a production environment will provide needed insights. A couple of things to keep in mind:
Minimize blast radius and have a backup plan in place to make sure the users and customers do not undergo downtime.
Mimic the load in a staging environment in case Service Level Agreements are too tight to cover any downtime.
Enable Observability:
Chaos Engineering Without Observability … Is Just Chaos.
Make sure to have logging and monitoring installed on the cluster to help with understanding the behaviour as to why it is happening. In case of running the tests in the CI where it is not humanly possible to monitor the cluster all the time, it is recommended to leverage Cerberus to capture the state during the runs and metrics collection in Kraken to store metrics long term even after the cluster is gone.
Kraken ships with dashboards that will help understand API, Etcd and Kubernetes cluster level stats and performance metrics.
Pay attention to Prometheus alerts. Check if they are firing as expected.
Run multiple chaos tests at once to mimic the production outages:
For example, hogging both IO and Network at the same time instead of running them separately to observe the impact.
You might have existing test cases, be it related to Performance, Scalability or QE. Run the chaos in the background during the test runs to observe the impact. Signaling feature in Kraken can help with coordinating the chaos runs i.e., start, stop, pause the scenarios based on the state of the other test jobs.
Chaos testing in Practice
OpenShift organization
Within the OpenShift organization we use kraken to perform chaos testing throughout a release before the code is available to customers.
1. We execute kraken during our regression test suite.
i. We cover each of the chaos scenarios across different clouds.
a. Our testing is predominantly done on AWS, Azure and GCP.
2. We run the chaos scenarios during a long running reliability test.
i. During this test we perform different types of tasks by different users on the cluster.
ii. We have added the execution of kraken to perform at certain times throughout the long running test and monitor the health of the cluster.
iii. This test can be seen here: https://github.com/openshift/svt/tree/master/reliability-v2
3. We are starting to add in test cases that perform chaos testing during an upgrade (not many iterations of this have been completed).
startx-lab
NOTE: Requests for enhancements and any issues need to be filed at the mentioned links given that they are not natively supported in Kraken.
The following content covers the implementation details around how Startx is leveraging Kraken:
Using kraken as part of a tekton pipeline
You can find on artifacthub.io the
kraken-scenariotekton-task
which can be used to start a kraken chaos scenarios as part of a chaos pipeline.
To use this task, you must have :
Openshift pipeline enabled (or tekton CRD loaded for Kubernetes clusters)
1 Secret named kraken-aws-creds for scenarios using aws
1 ConfigMap named kraken-kubeconfig with credentials to the targeted cluster
1 ConfigMap named kraken-config-example with kraken configuration file (config.yaml)
1 ConfigMap named kraken-common-example with all kraken related files
The pipeline SA with be authorized to run with privileged SCC
You can create theses resources using the following sequence :
Then you must change content of kraken-aws-creds secret, kraken-kubeconfig and kraken-config-example configMap
to reflect your cluster configuration. Refer to the kraken configuration
and configuration examples
for details on how to configure theses resources.
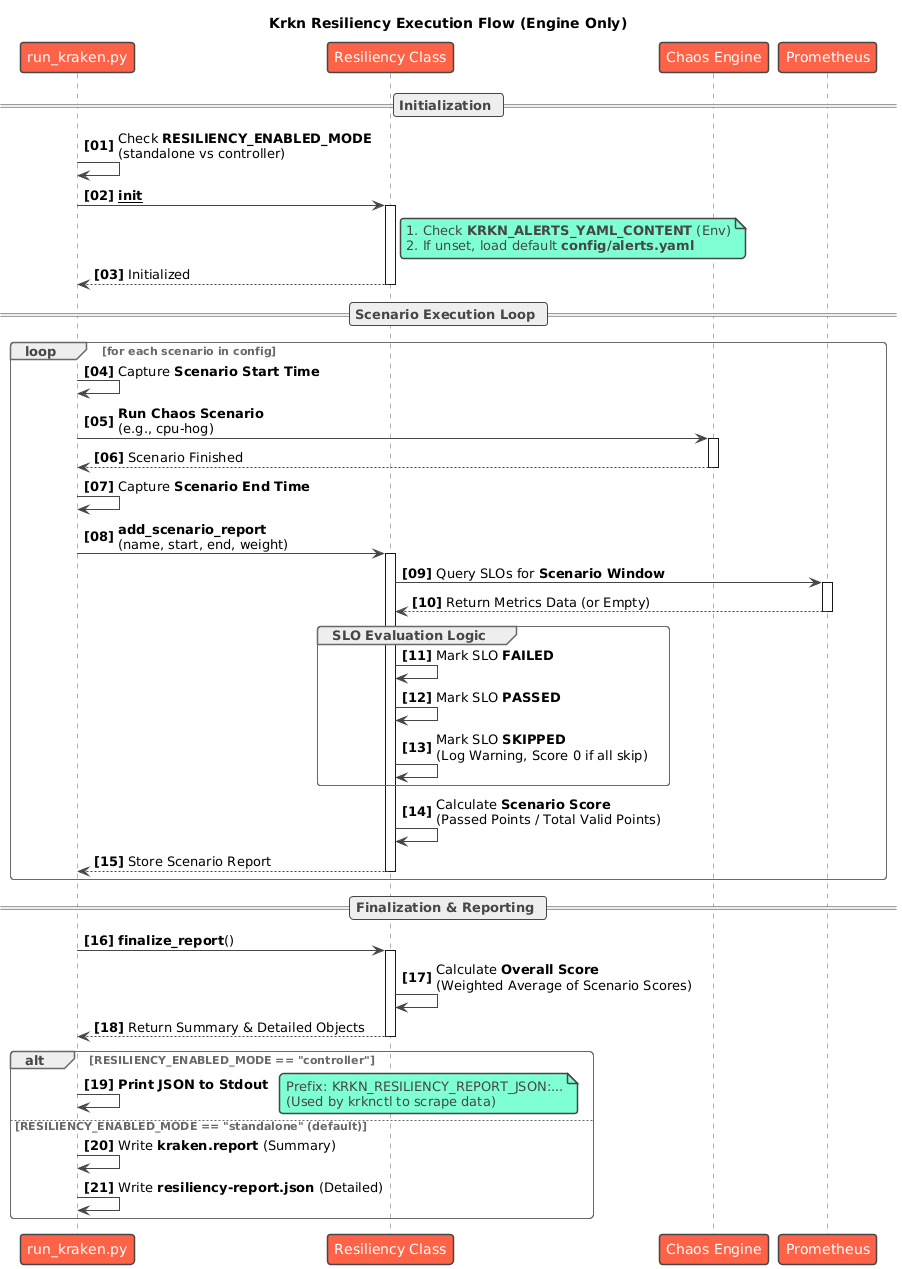
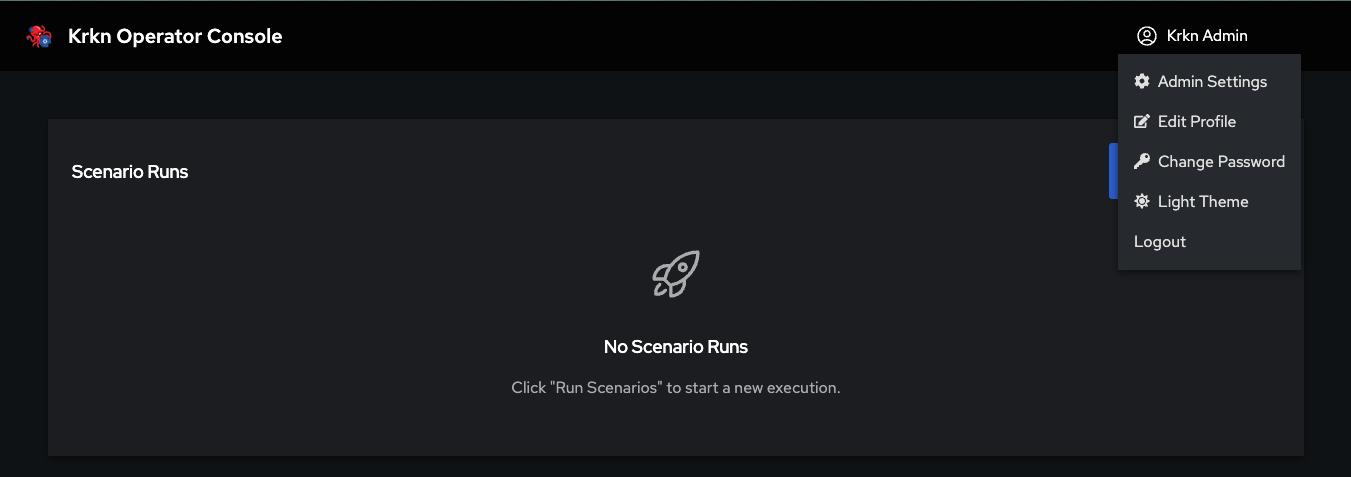
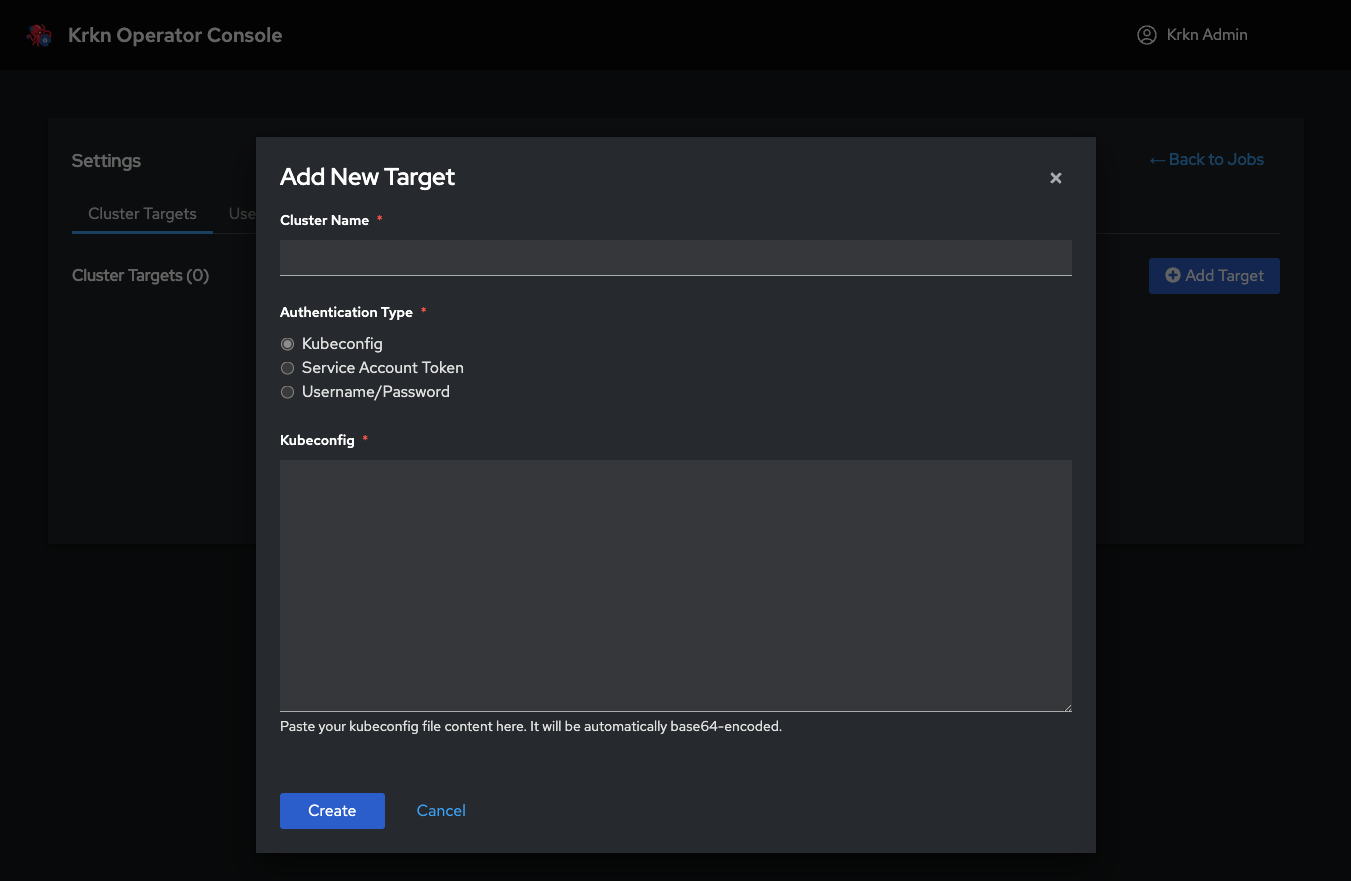
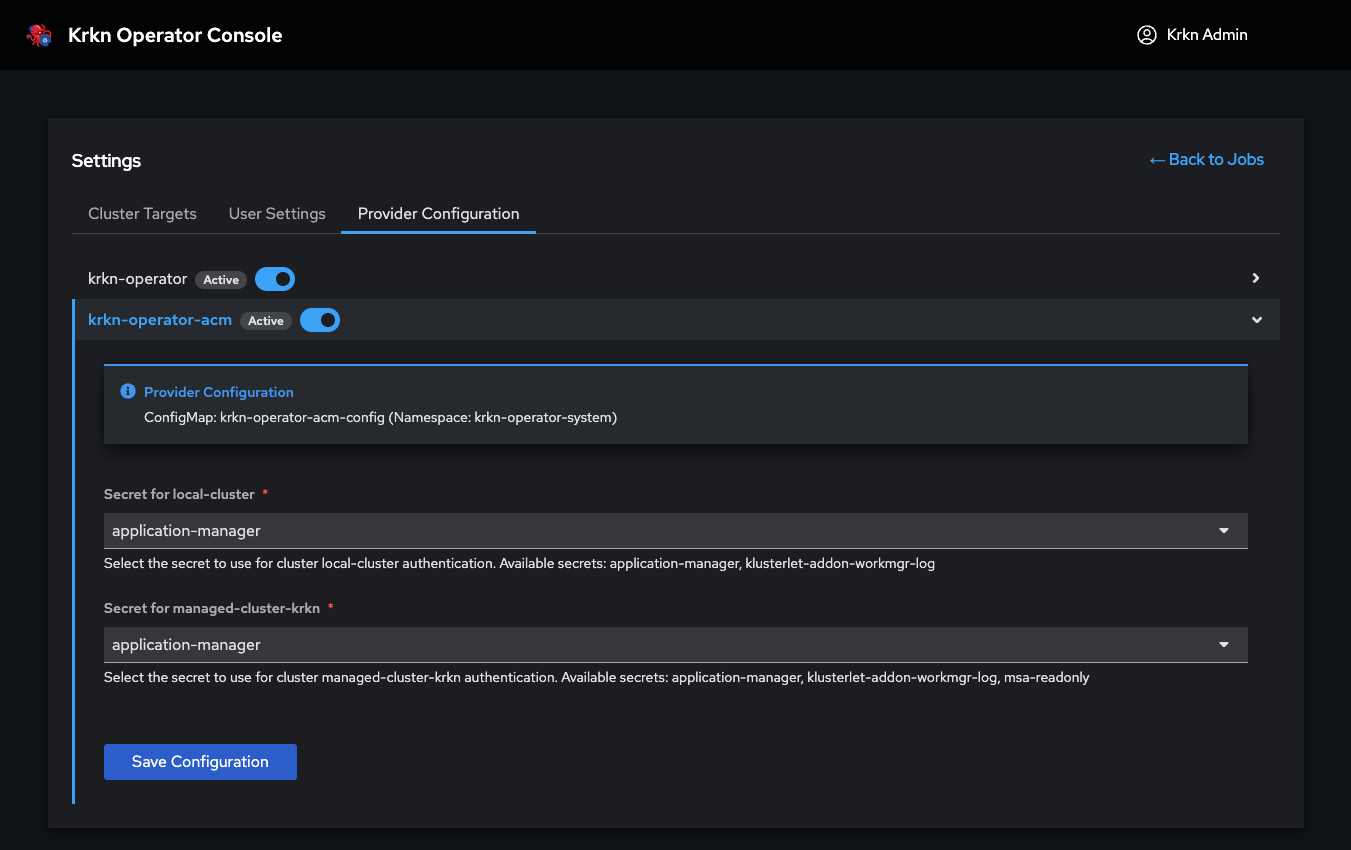
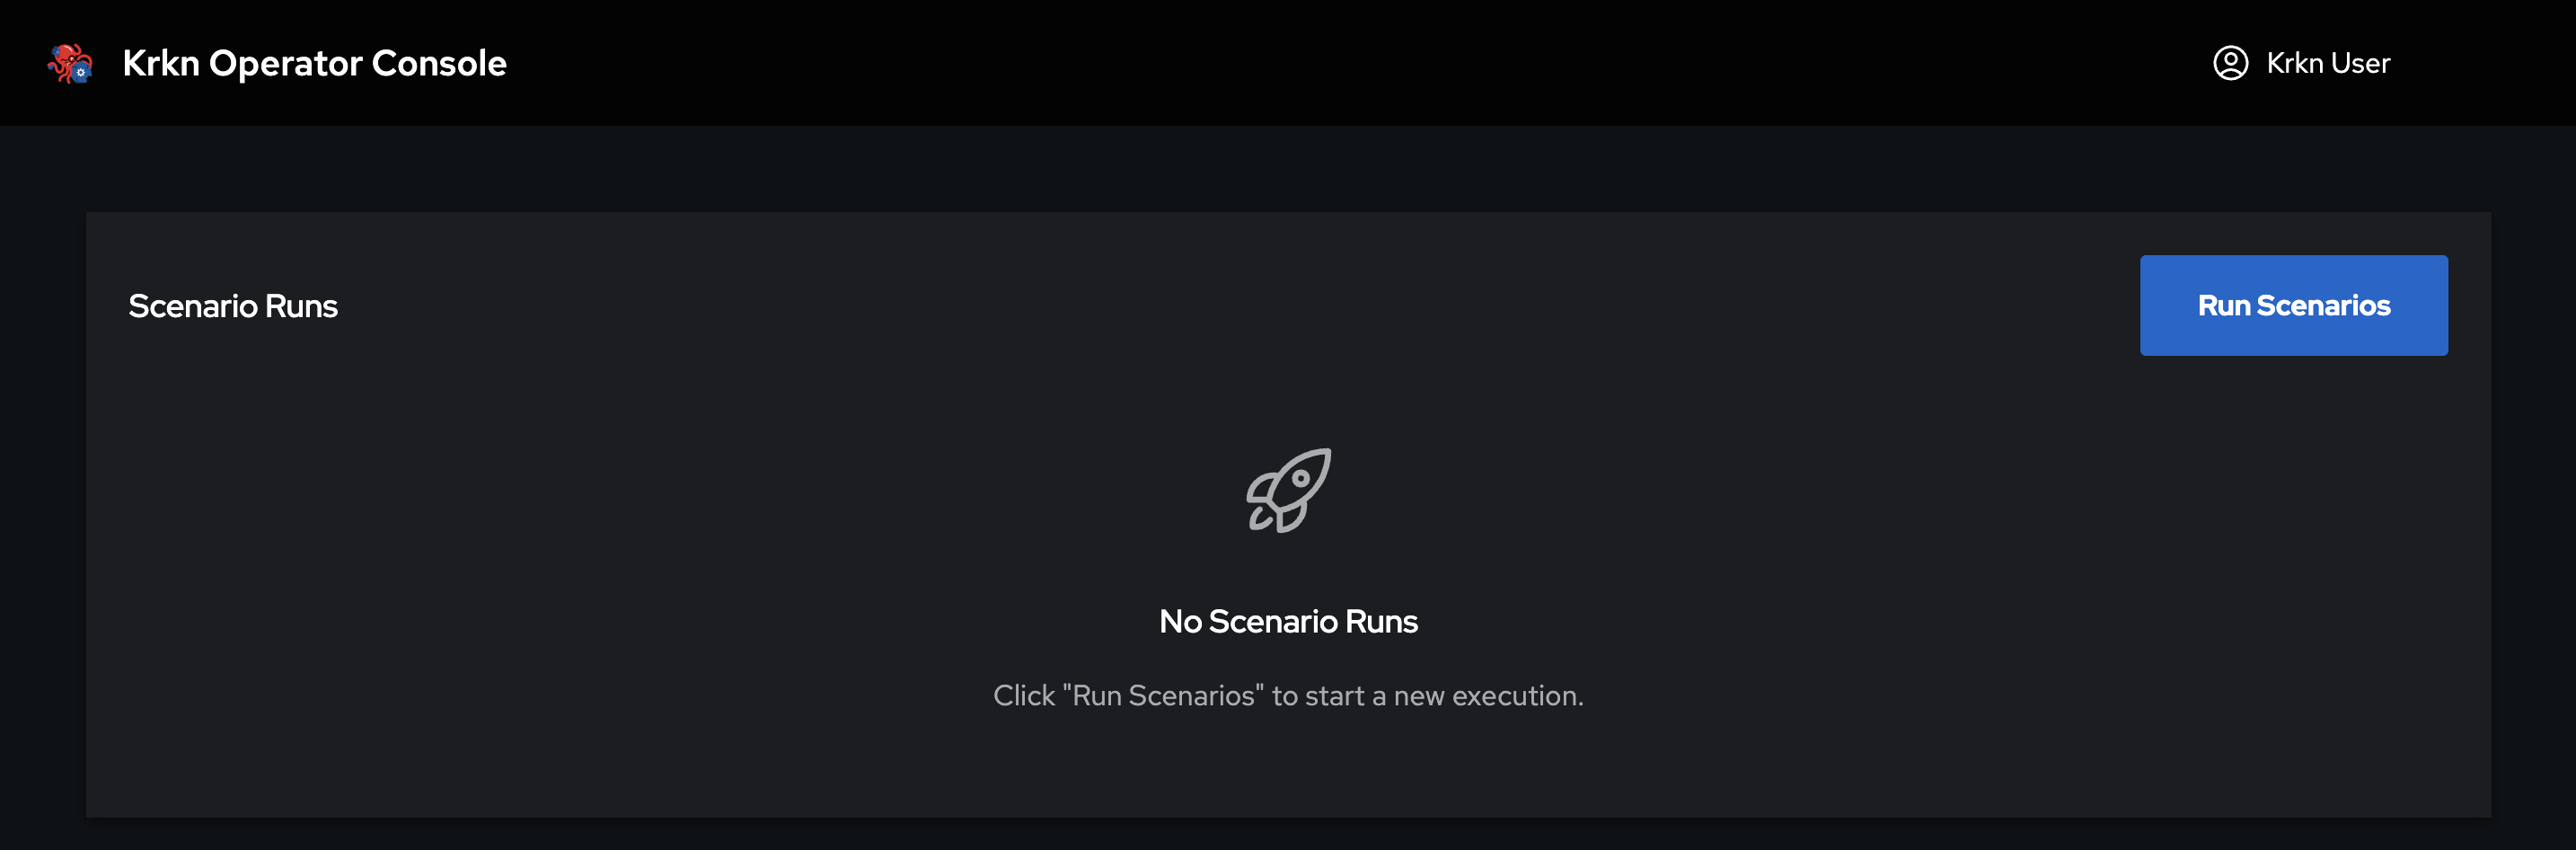
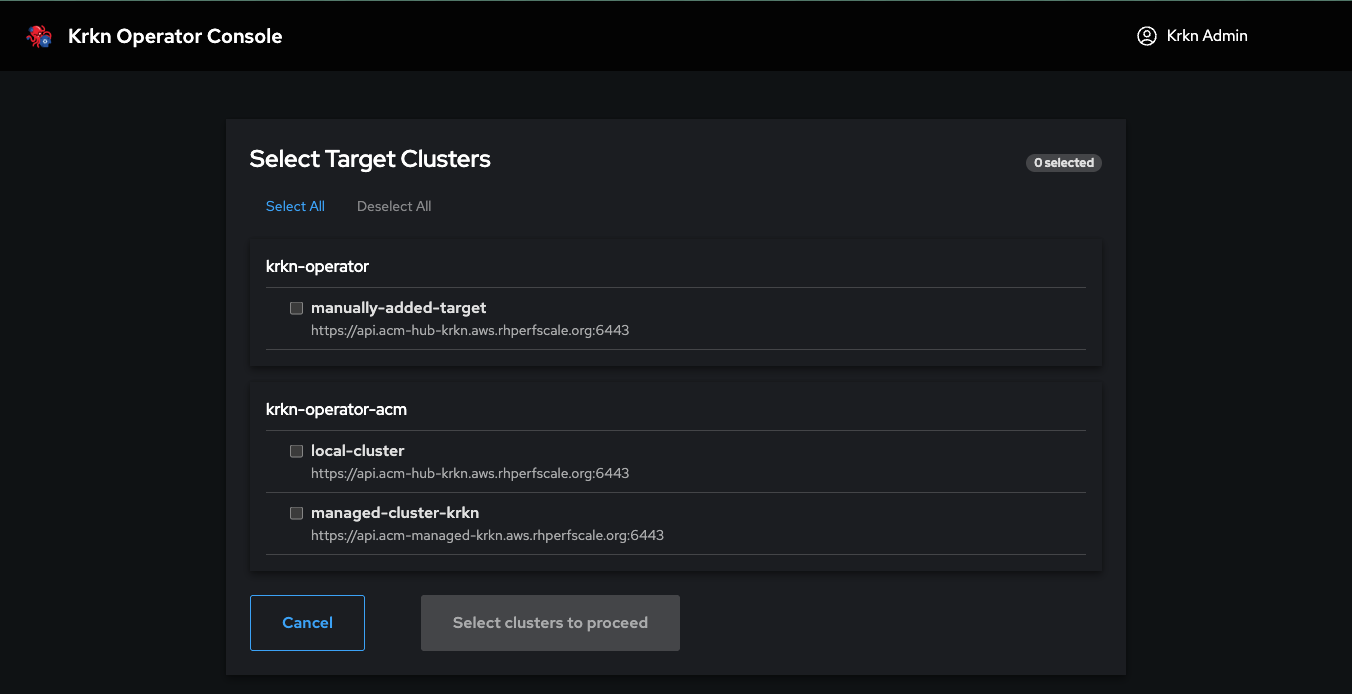
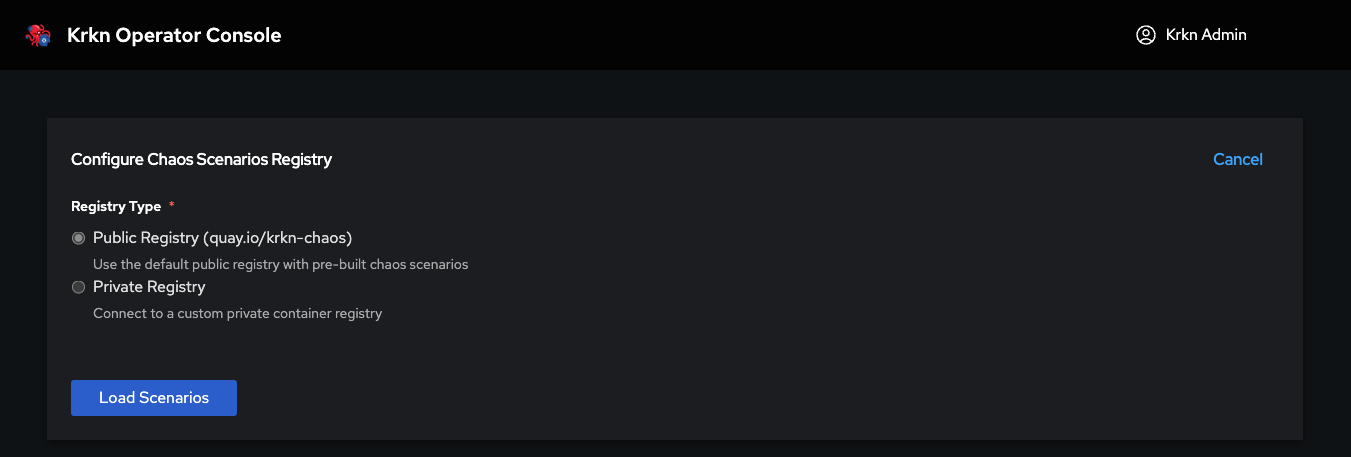

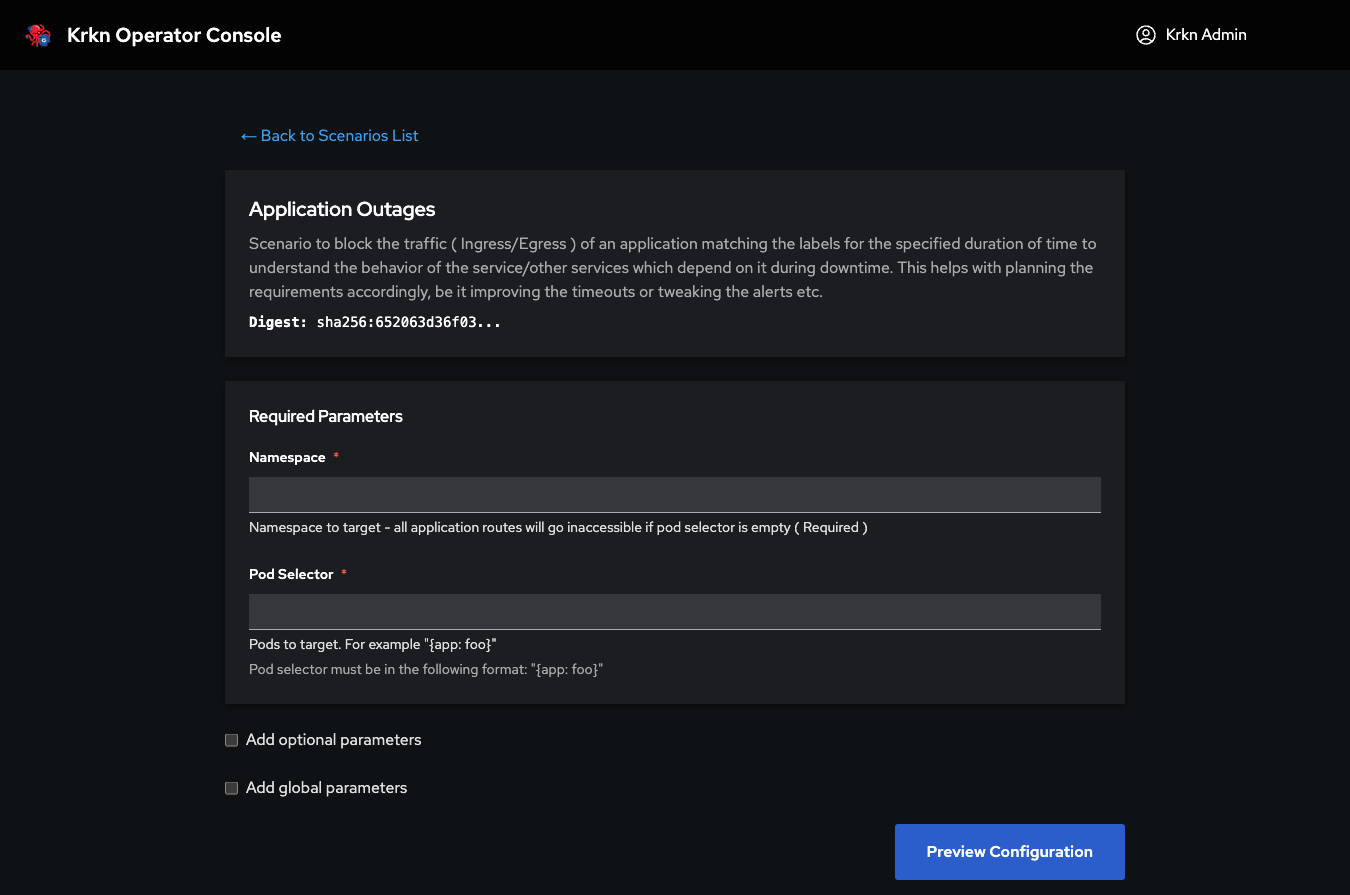
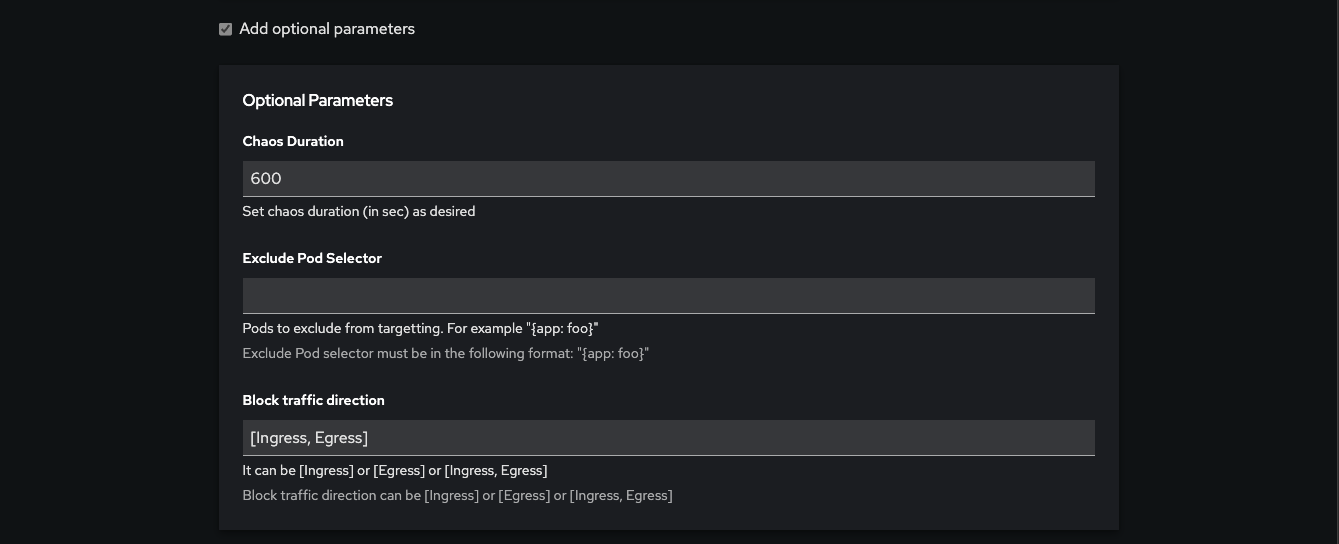
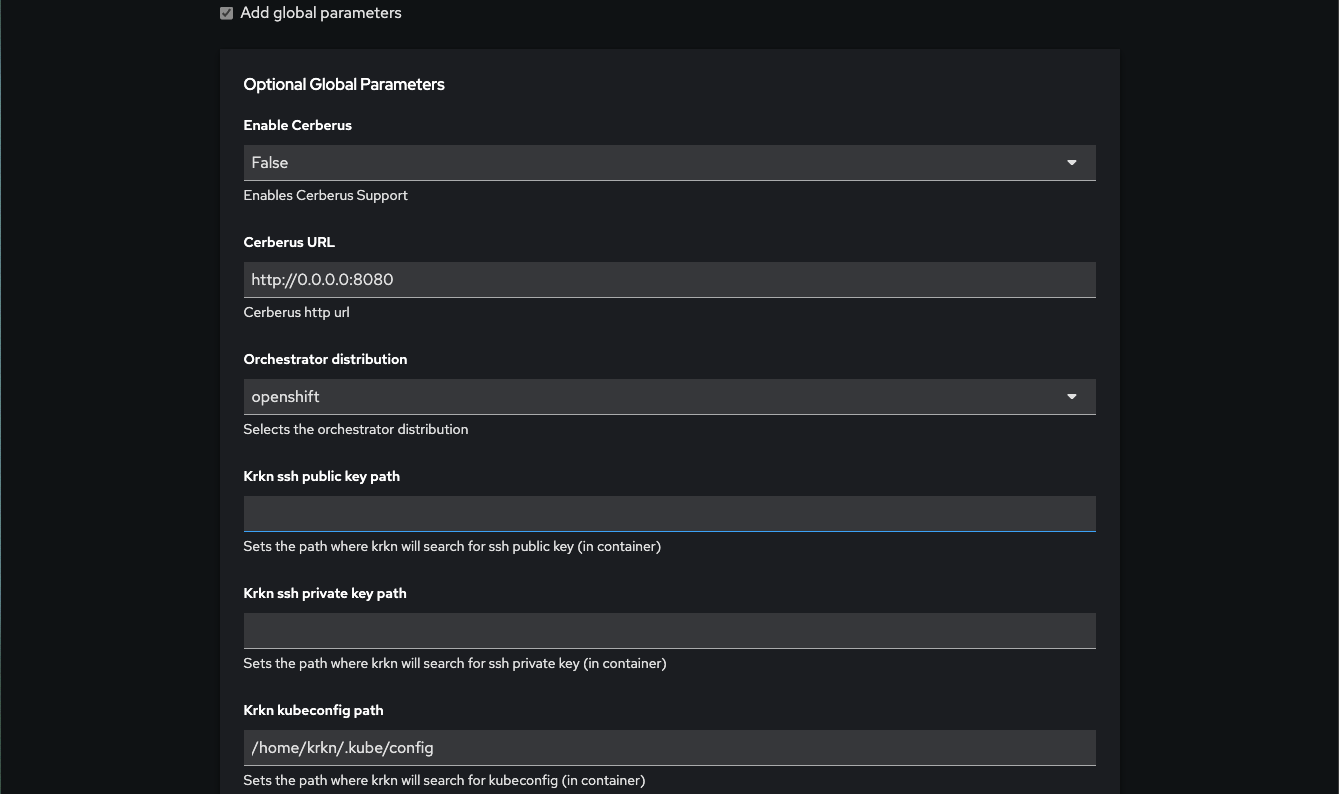
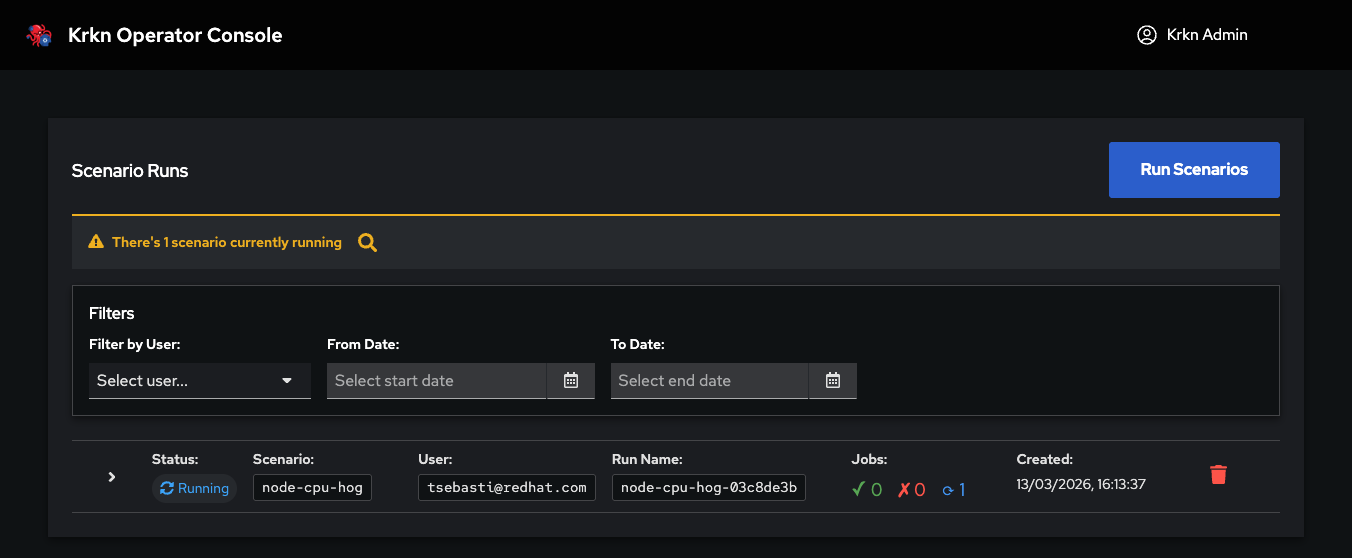
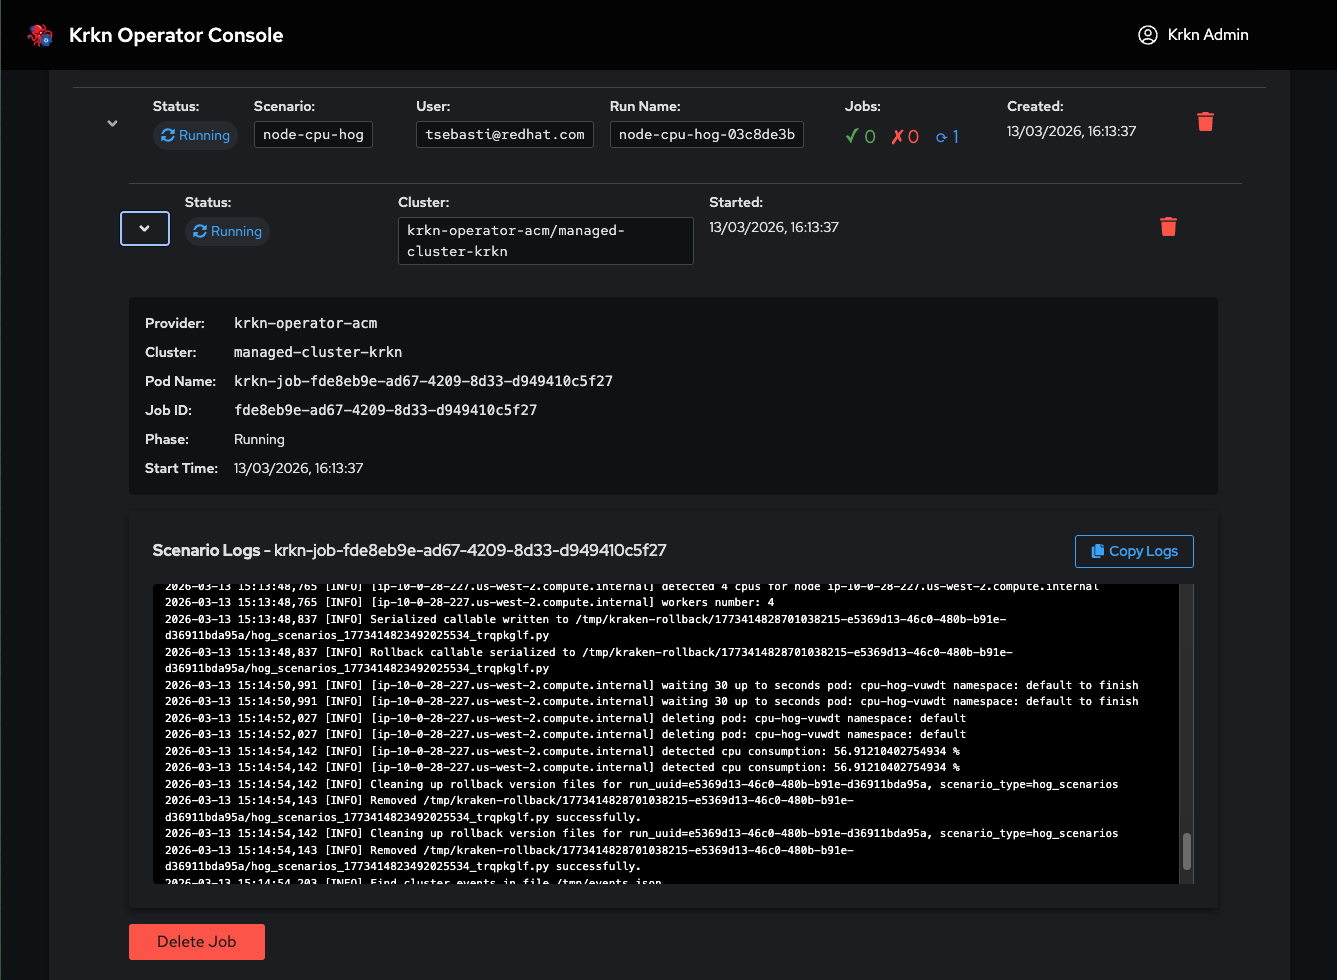
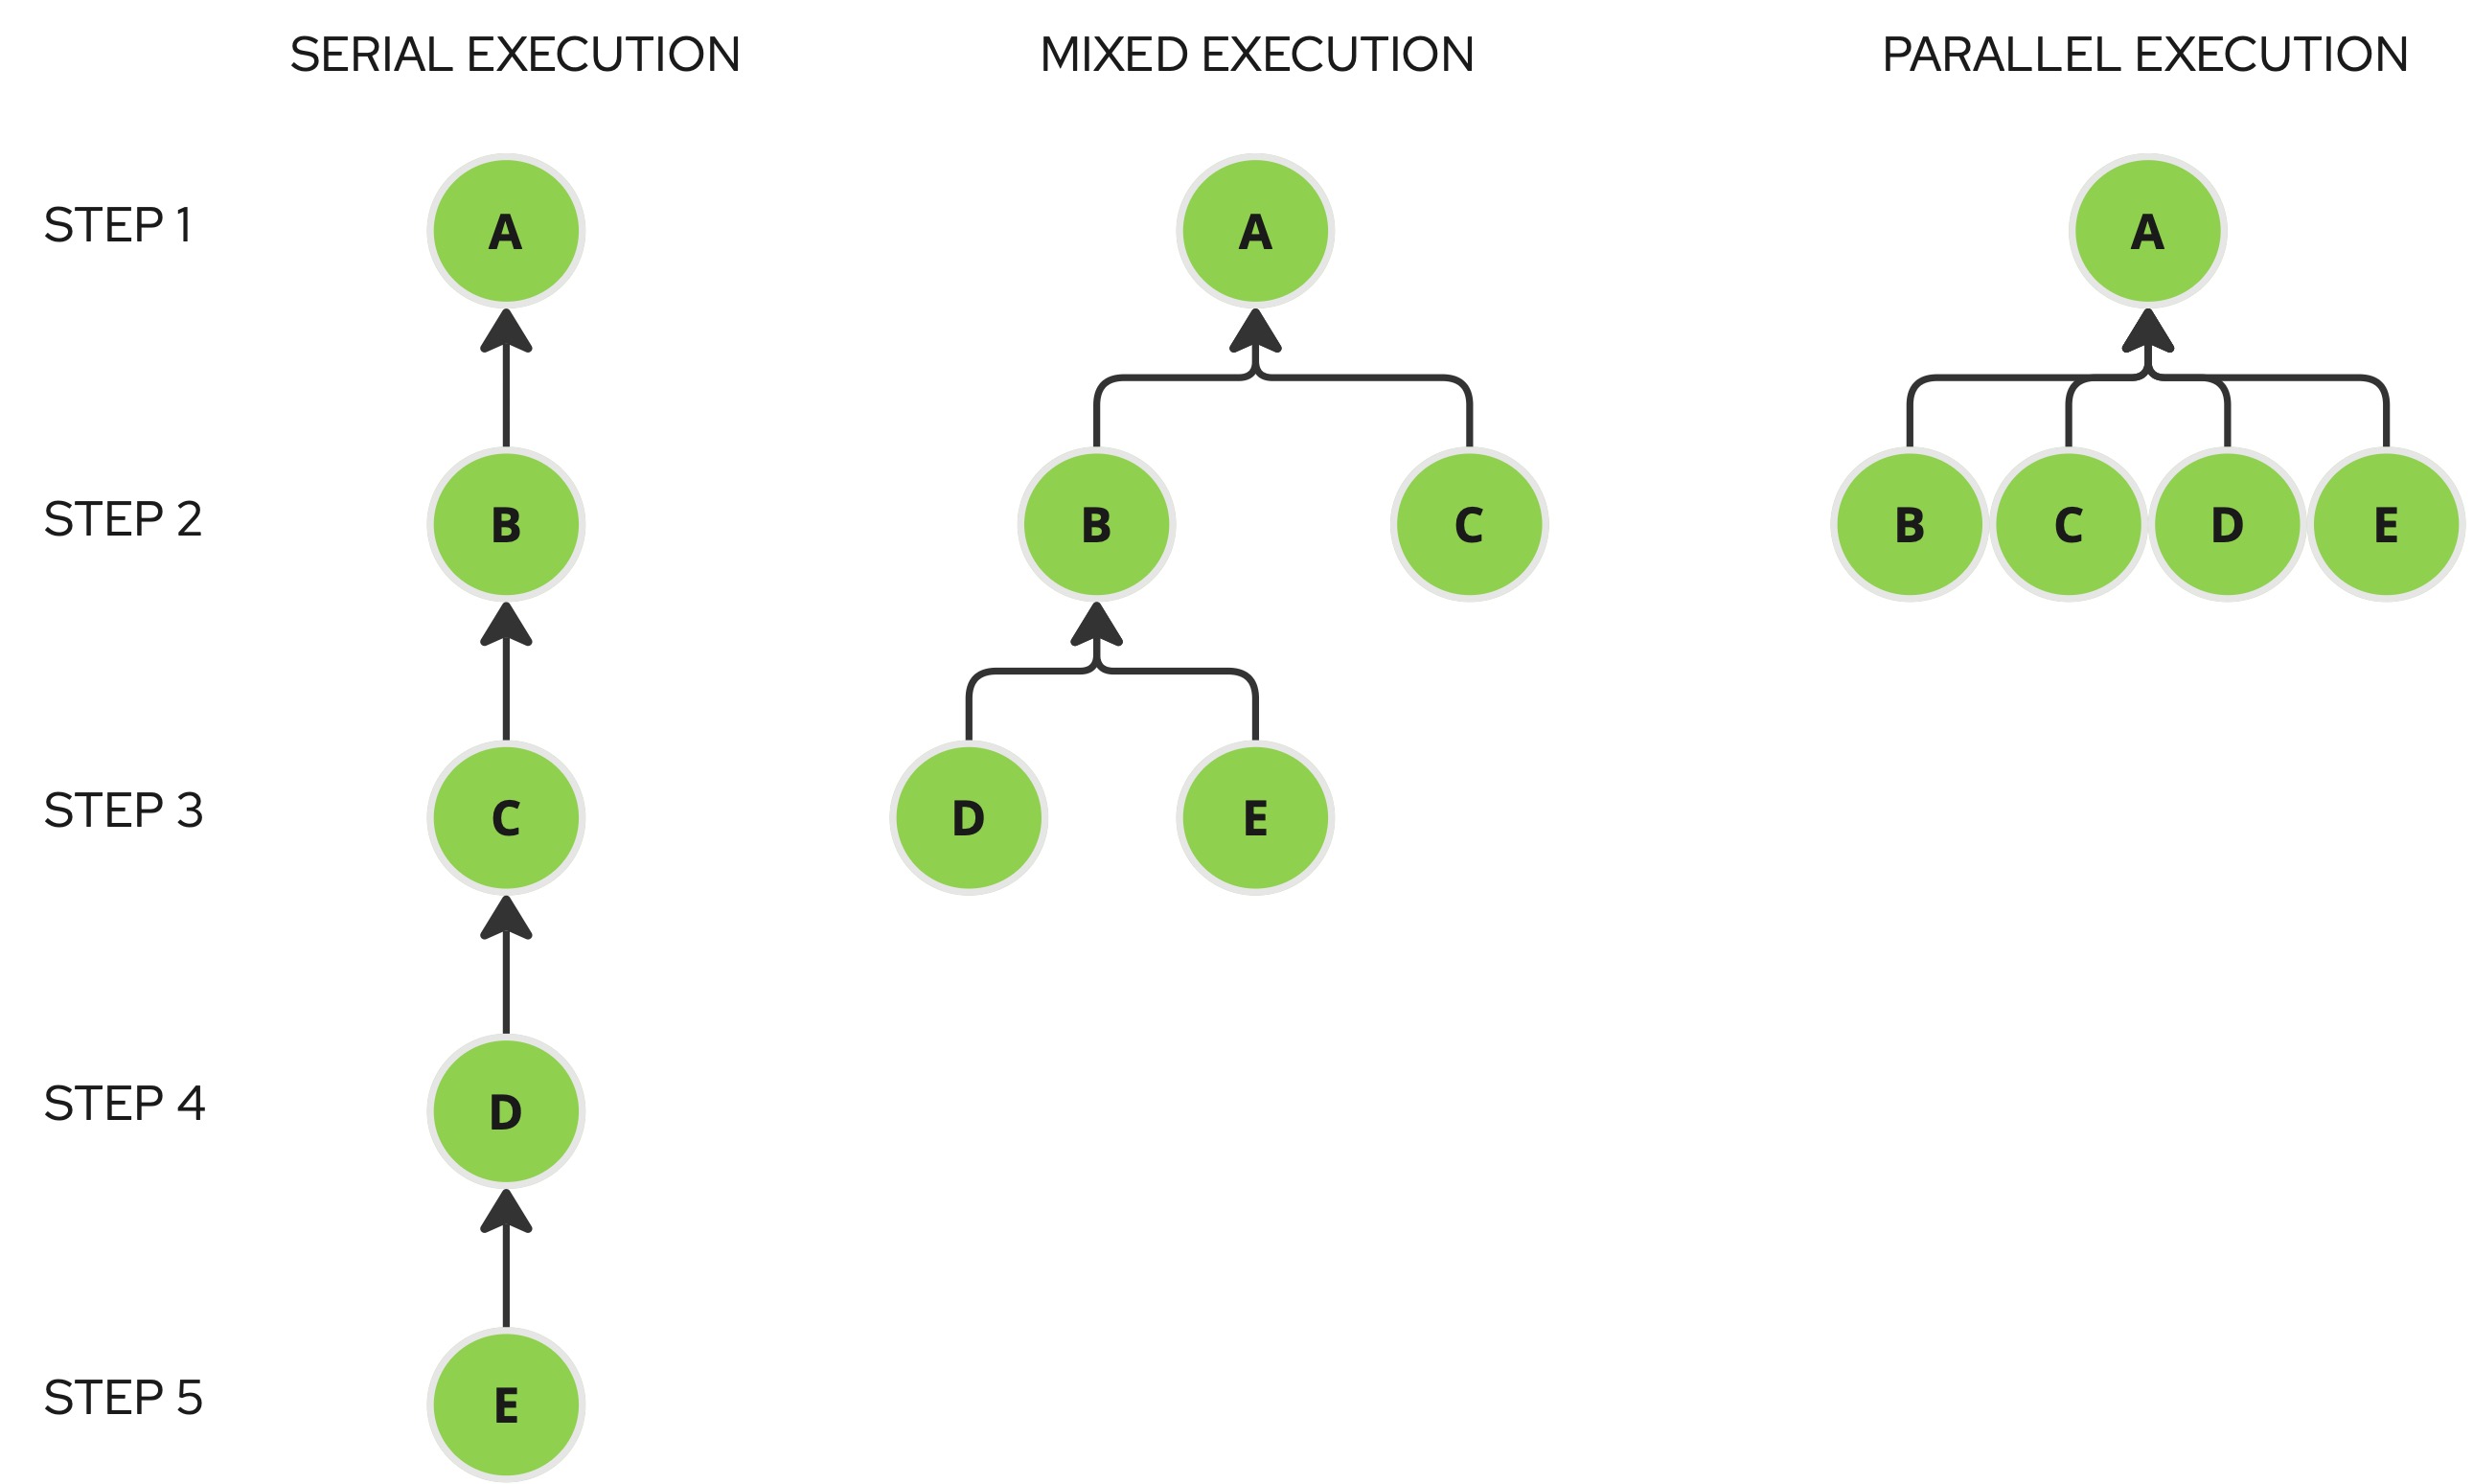
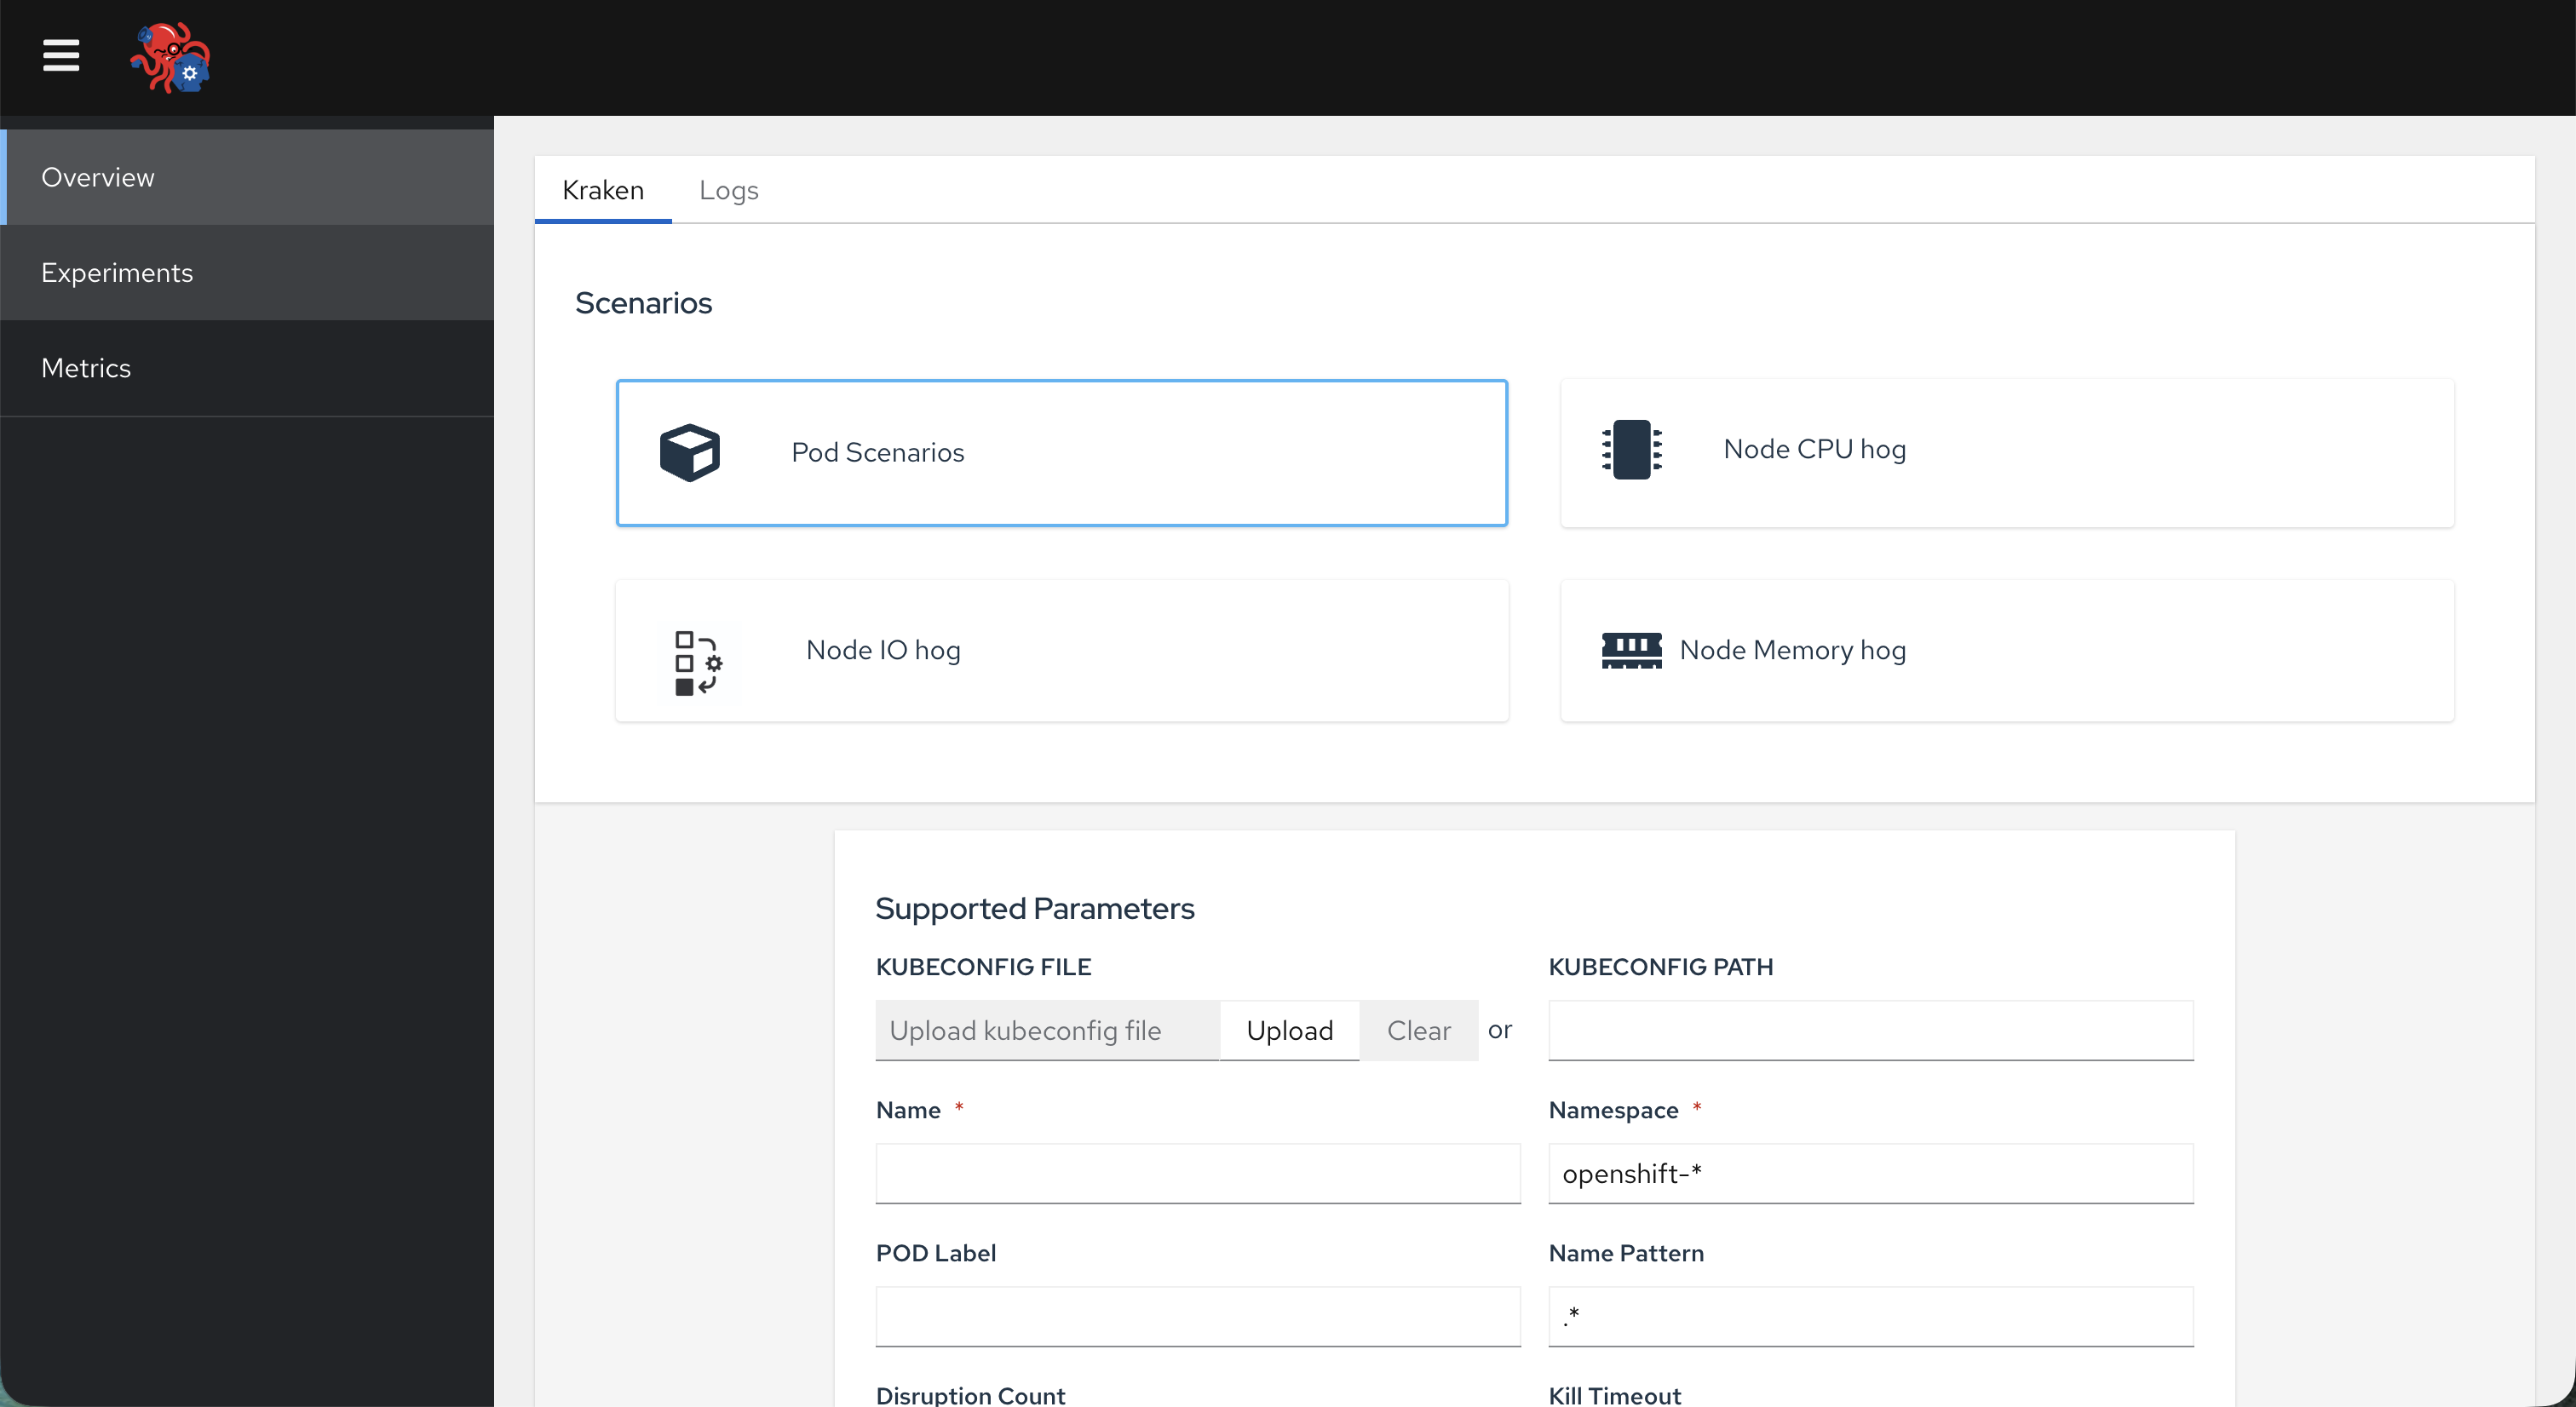
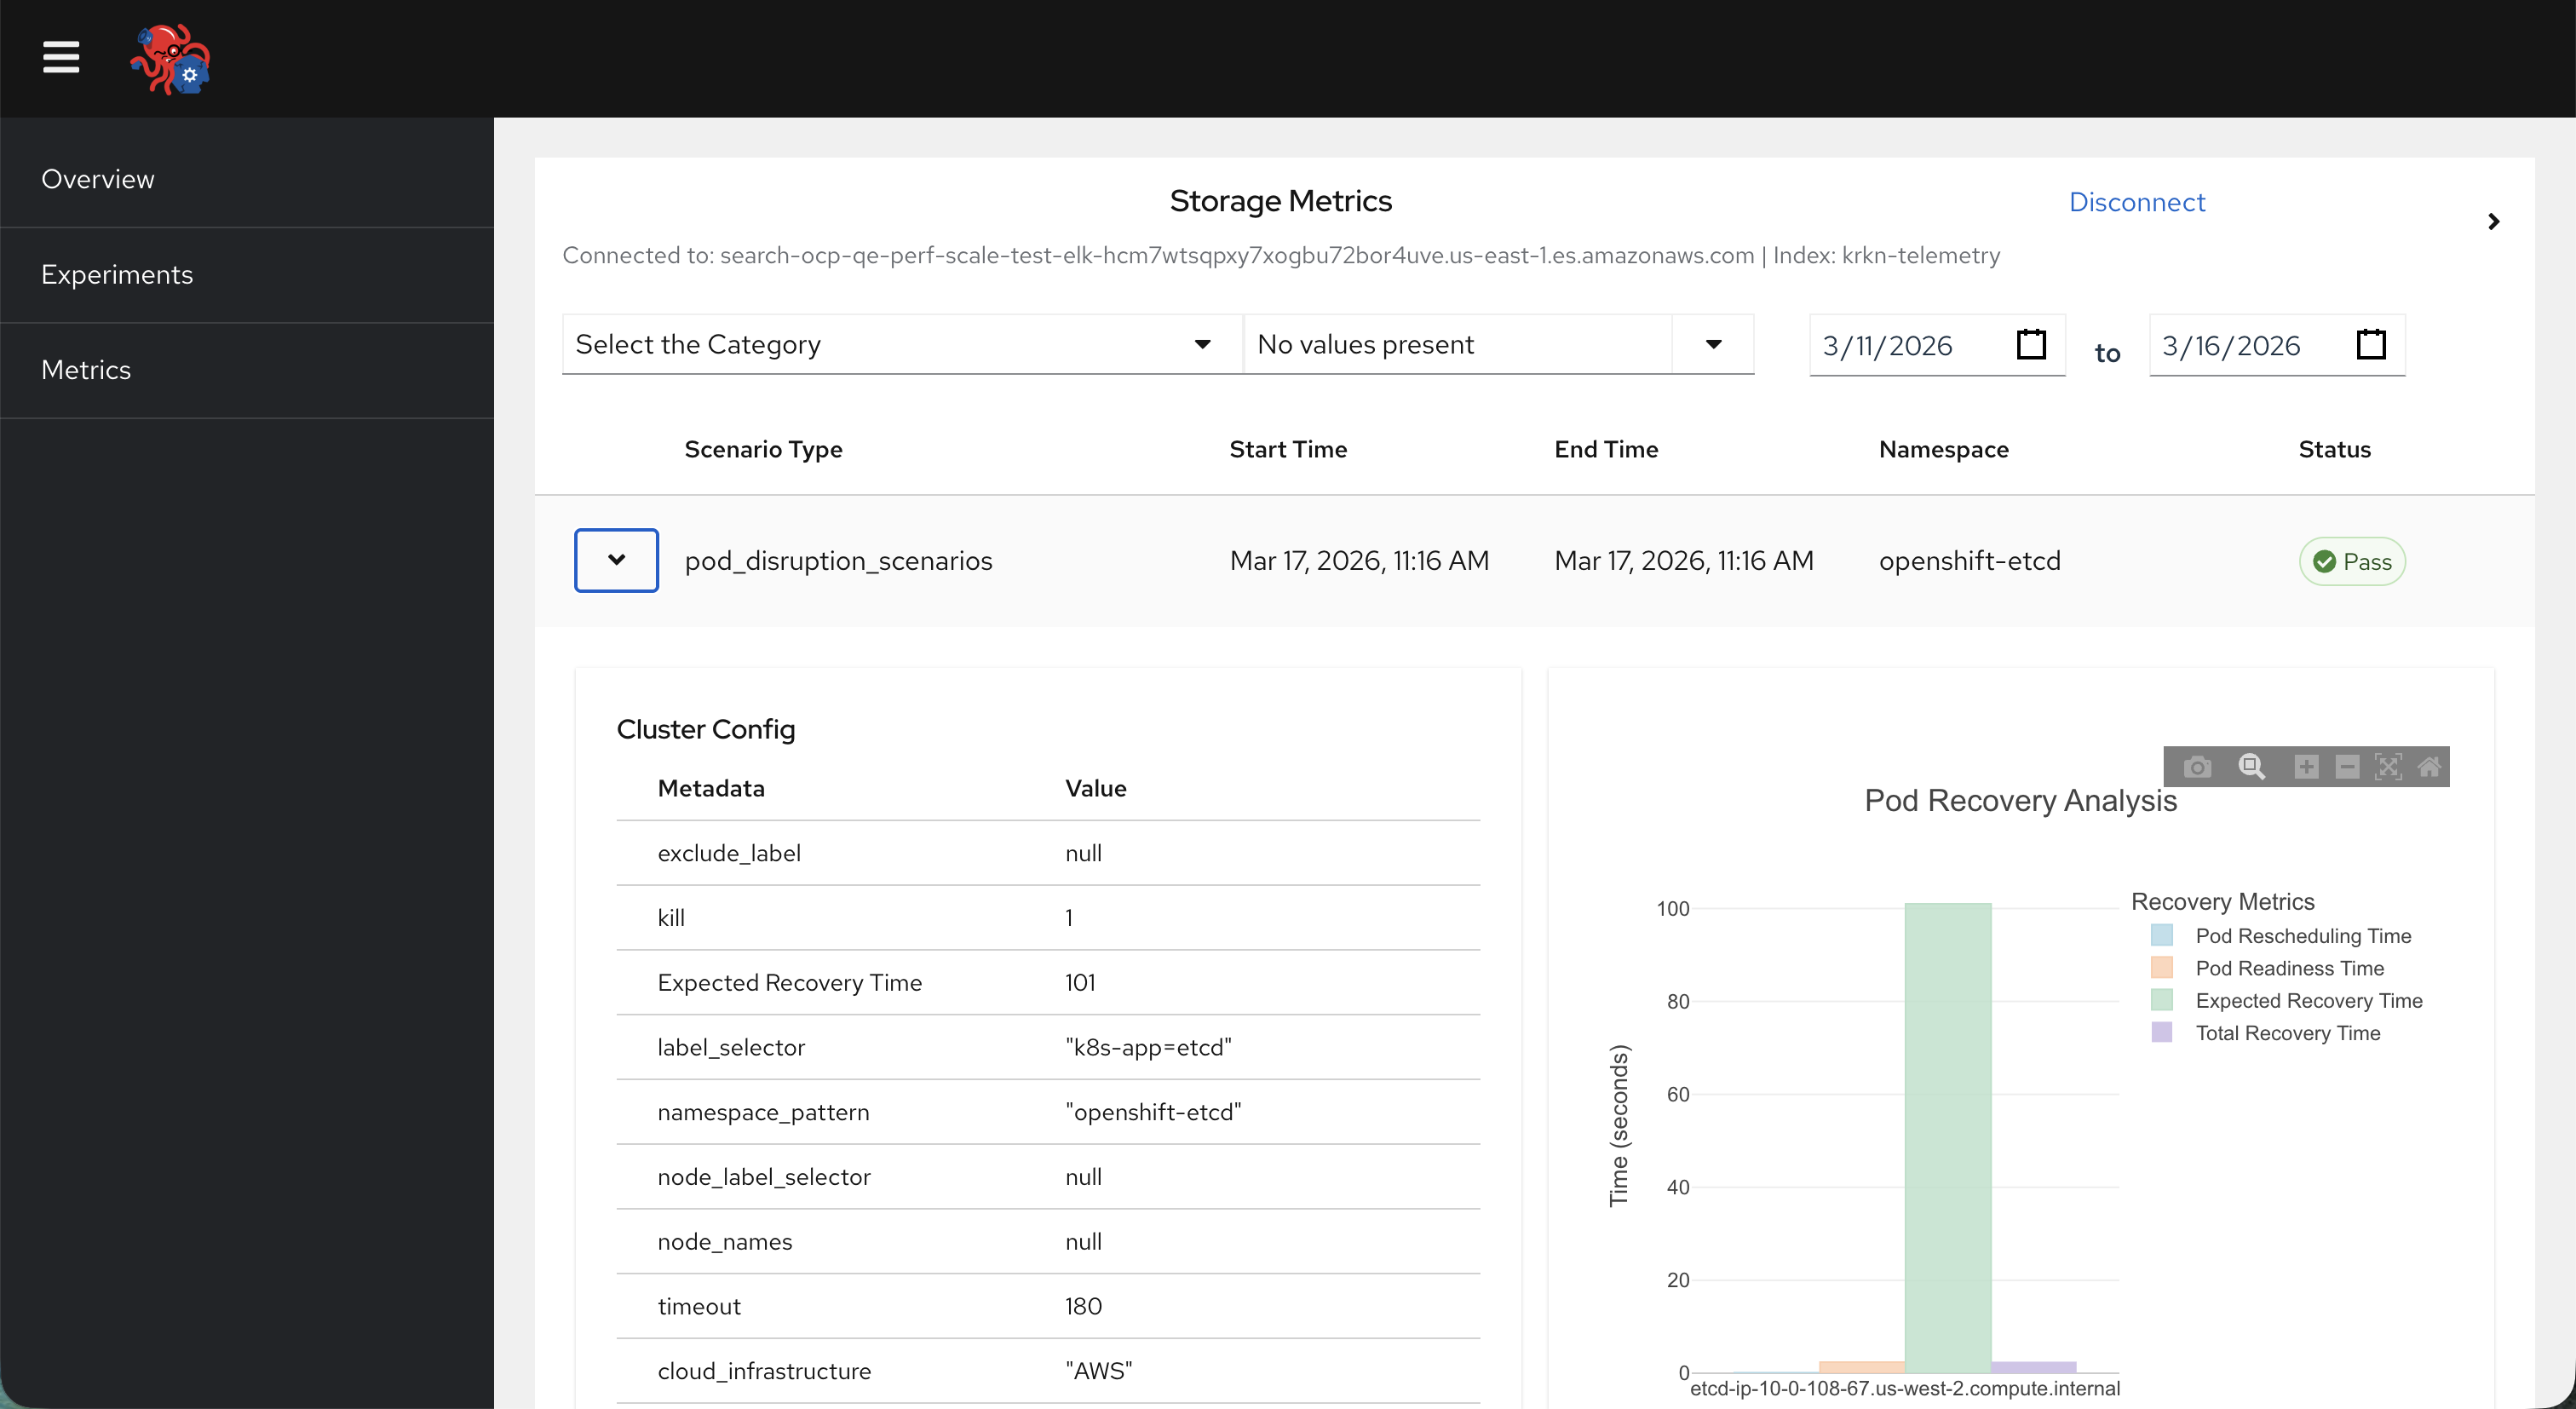
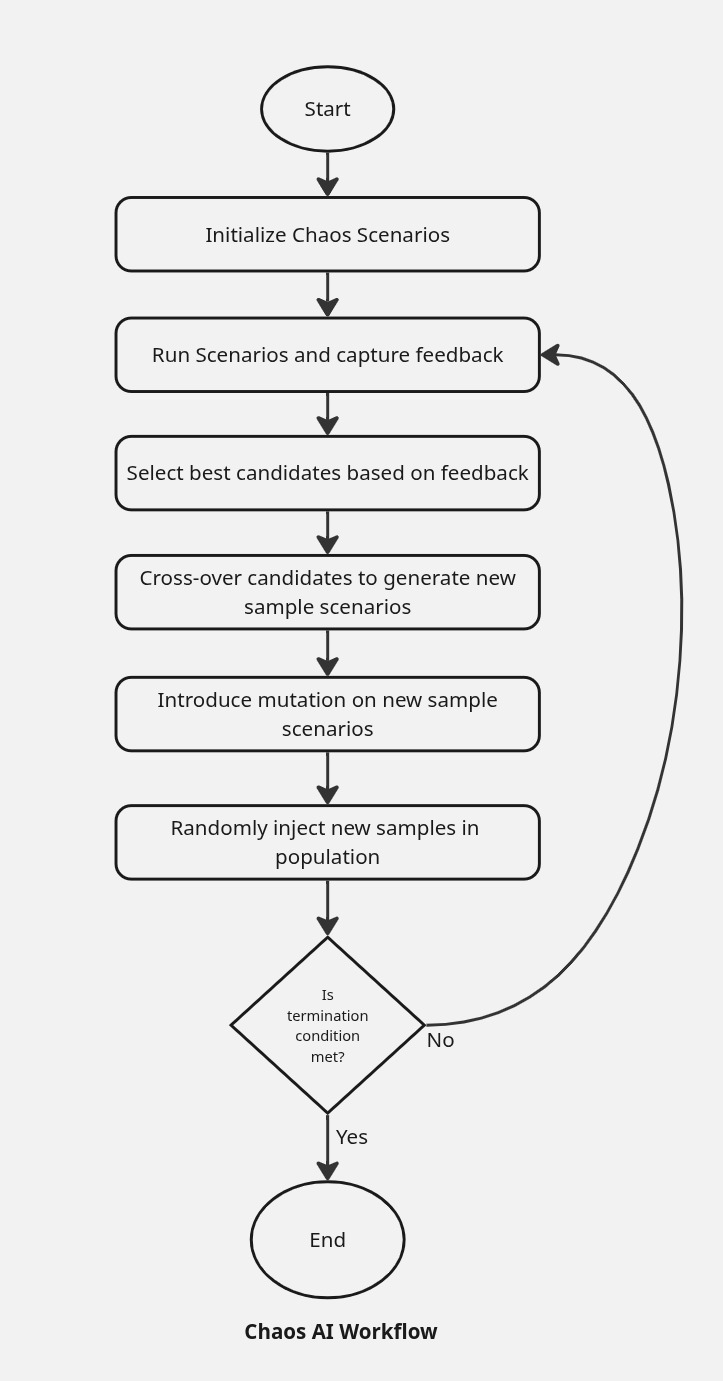
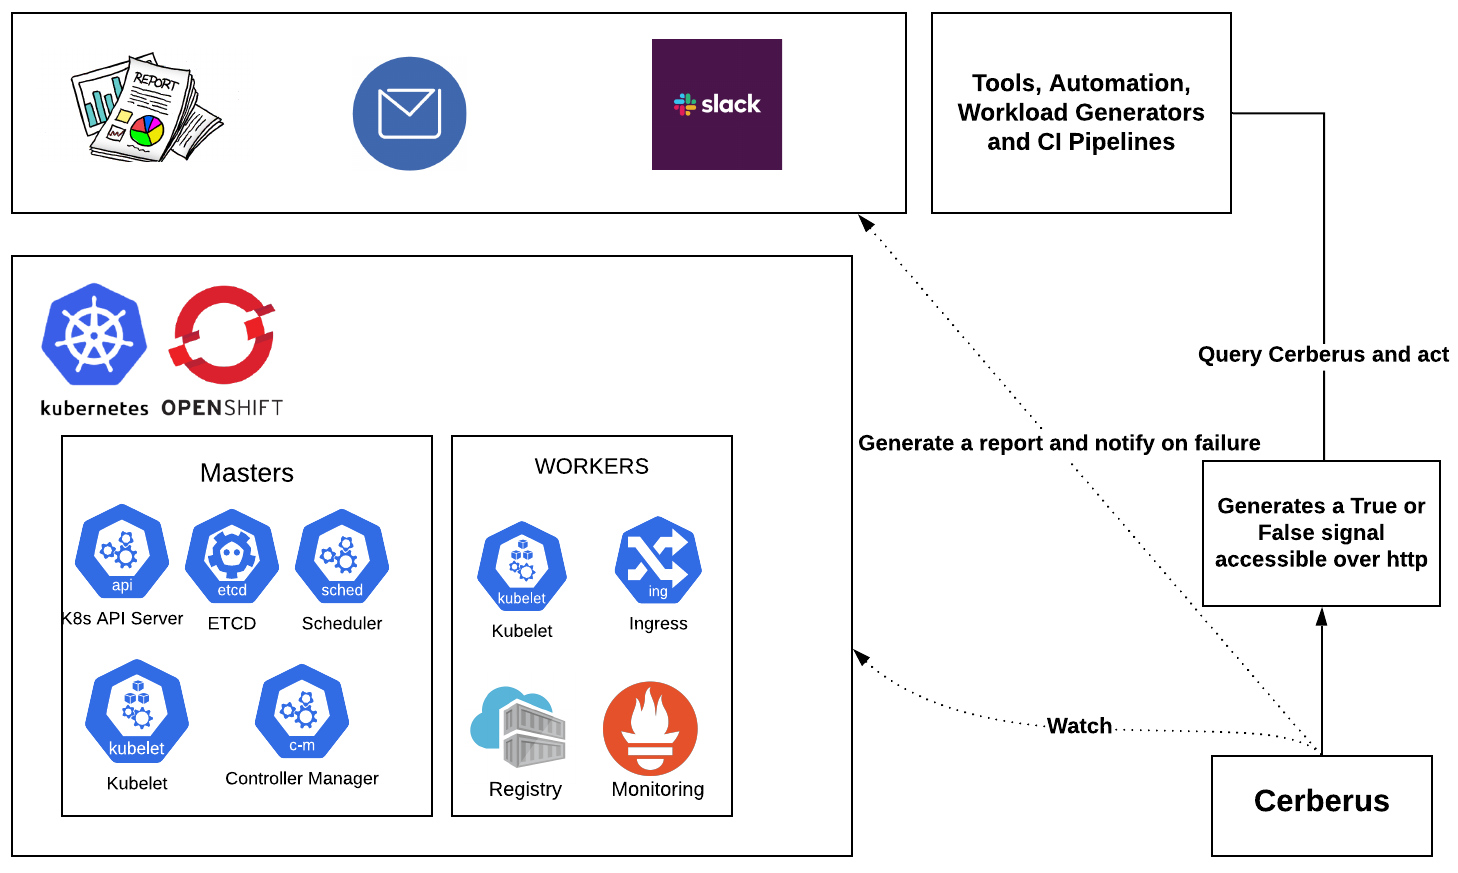

 (IntelliJ PyCharm)