Krkn Config Explanations
Krkn config field explanations
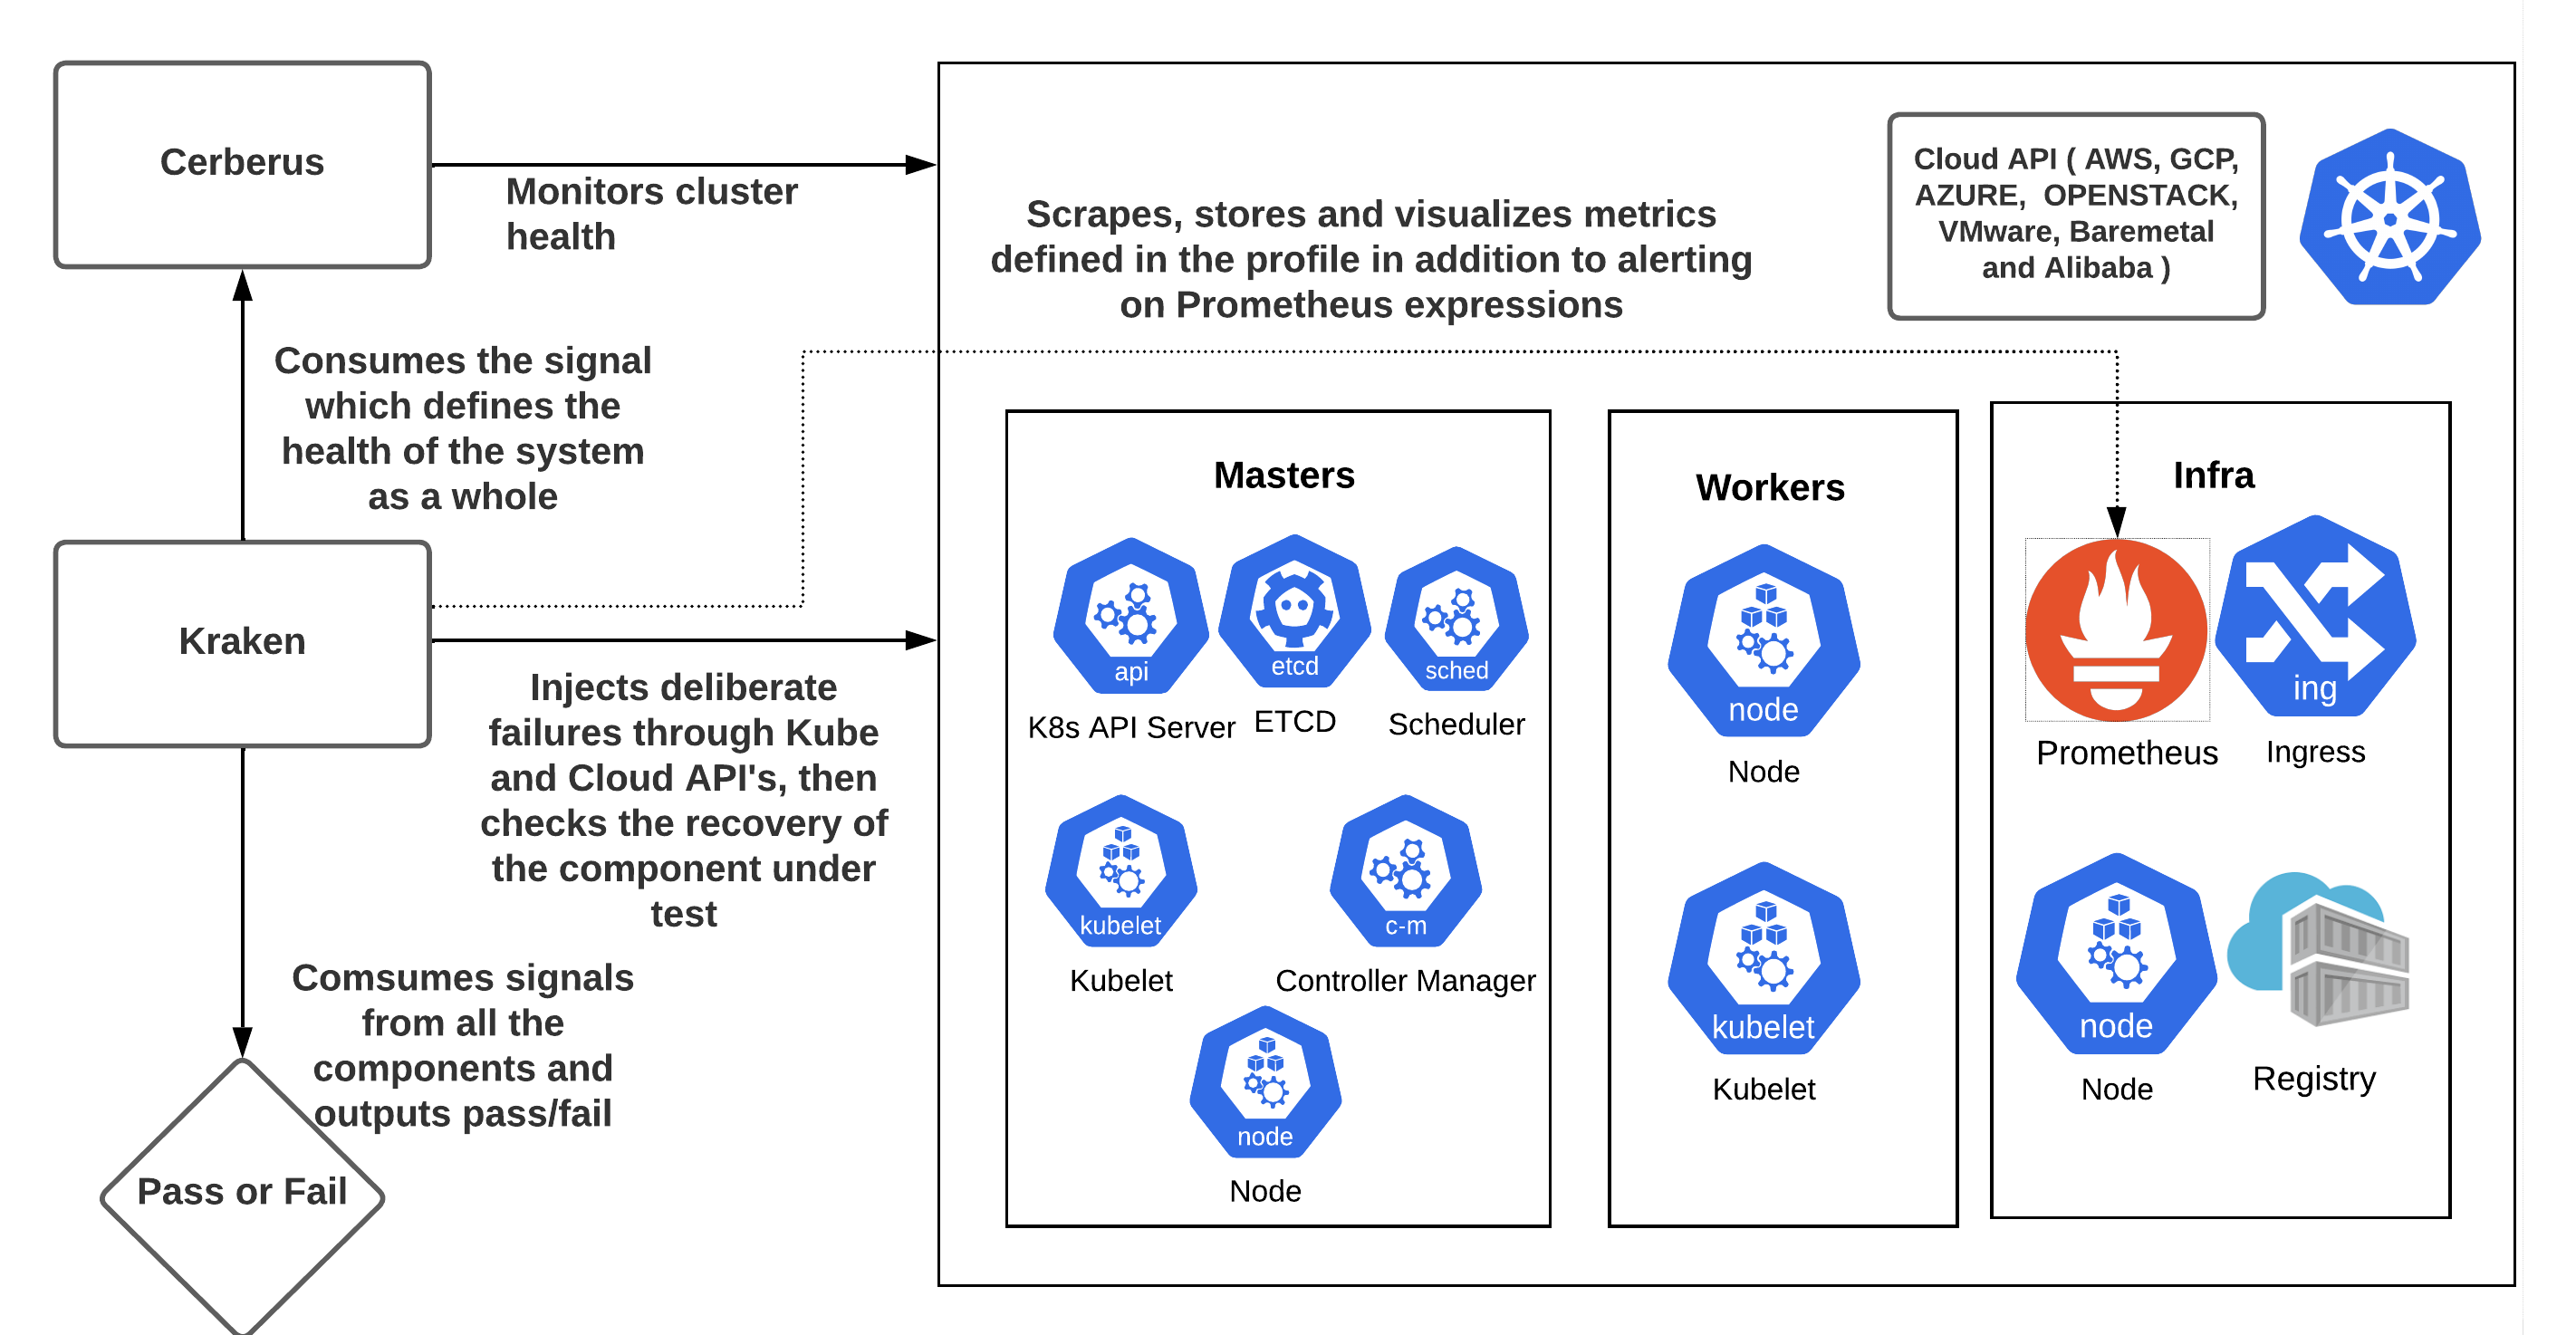
krkn is a chaos and resiliency testing tool for Kubernetes. Krkn injects deliberate failures into Kubernetes clusters to check if it is resilient to turbulent conditions.
Krkn is designed for the following user roles:
Instructions on how to setup, configure and run Krkn can be found at Installation.
You may consider utilizing the chaos recommendation tool prior to initiating the chaos runs to profile the application service(s) under test. This tool discovers a list of Krkn scenarios with a high probability of causing failures or disruptions to your application service(s). The tool can be accessed at Chaos-Recommender.
See the getting started doc on support on how to get started with your own custom scenario or editing current scenarios for your specific usage.
After installation, refer back to the below sections for supported scenarios and how to tweak the Krkn config to load them on your cluster.
For cases where you want to run Krkn with minimal configuration changes, refer to krkn-hub. One use case is CI integration where you do not want to carry around different configuration files for the scenarios.
Instructions on how to setup the config and the options supported can be found at Config.
It is important to check if the targeted component recovered from the chaos injection and if the Kubernetes cluster is healthy, since failures in one component can have an adverse impact on other components. Krkn does this by:
check_application_routes: True in the Krkn config provided application routes are being monitored in the cerberus config.In CI runs or any external job it is useful to stop Krkn once a certain test or state gets reached. We created a way to signal to Krkn to pause the chaos or stop it completely using a signal posted to a port of your choice.
For example, if we have a test run loading the cluster running and Krkn separately running, we want to be able to know when to start/stop the Krkn run based on when the test run completes or when it gets to a certain loaded state
More detailed information on enabling and leveraging this feature can be found here.
Monitoring the Kubernetes/OpenShift cluster to observe the impact of Krkn chaos scenarios on various components is key to find out the bottlenecks. It is important to make sure the cluster is healthy in terms of both recovery and performance during and after the failure has been injected. Instructions on enabling it within the config can be found here.
Information on enabling and leveraging this feature can be found here
Health checks provide real-time visibility into the impact of chaos scenarios on application availability and performance. The system periodically checks the provided URLs based on the defined interval and records the results in Telemetry. To read more about how to properly configure health checks in your krkn run and sample output see health checks document.
We gather some basic details of the cluster configuration and scenarios ran as part of a telemetry set of data that is printed off at the end of each krkn run. You can also opt in to the telemetry being stored in AWS S3 bucket or elasticsearch for long term storage. Find more details and configuration specifics here
We have a powerful feature to quantify your system’s stability during chaos experiments. The Resiliency Score is a percentage (0-100%) calculated from a weighted evaluation of SLOs firing in Prometheus. This moves beyond a simple pass/fail, giving you a clear, data-driven metric to track your resilience over time. Find a detailed explanation of the scoring algorithm and configuration options here.
Krkn supports injecting faults into Open Cluster Management (OCM) and Red Hat Advanced Cluster Management for Kubernetes (ACM) managed clusters through ManagedCluster Scenarios.
Krkn config field explanations
Health Checks to analyze down times of applications
RBAC Authorization rules required to run Krkn scenarios.
Krkn roadmap of work items and goals
Kube Virt Checks to analyze down times of VMIs
Resiliency Scoring Calculation Algorithm and Configuration
Signal to stop/start/pause krkn
Validation points in krkn
Telemetry run details of the cluster and scenario