What is Krkn?
Chaos and Resiliency Testing Tool for Kubernetes
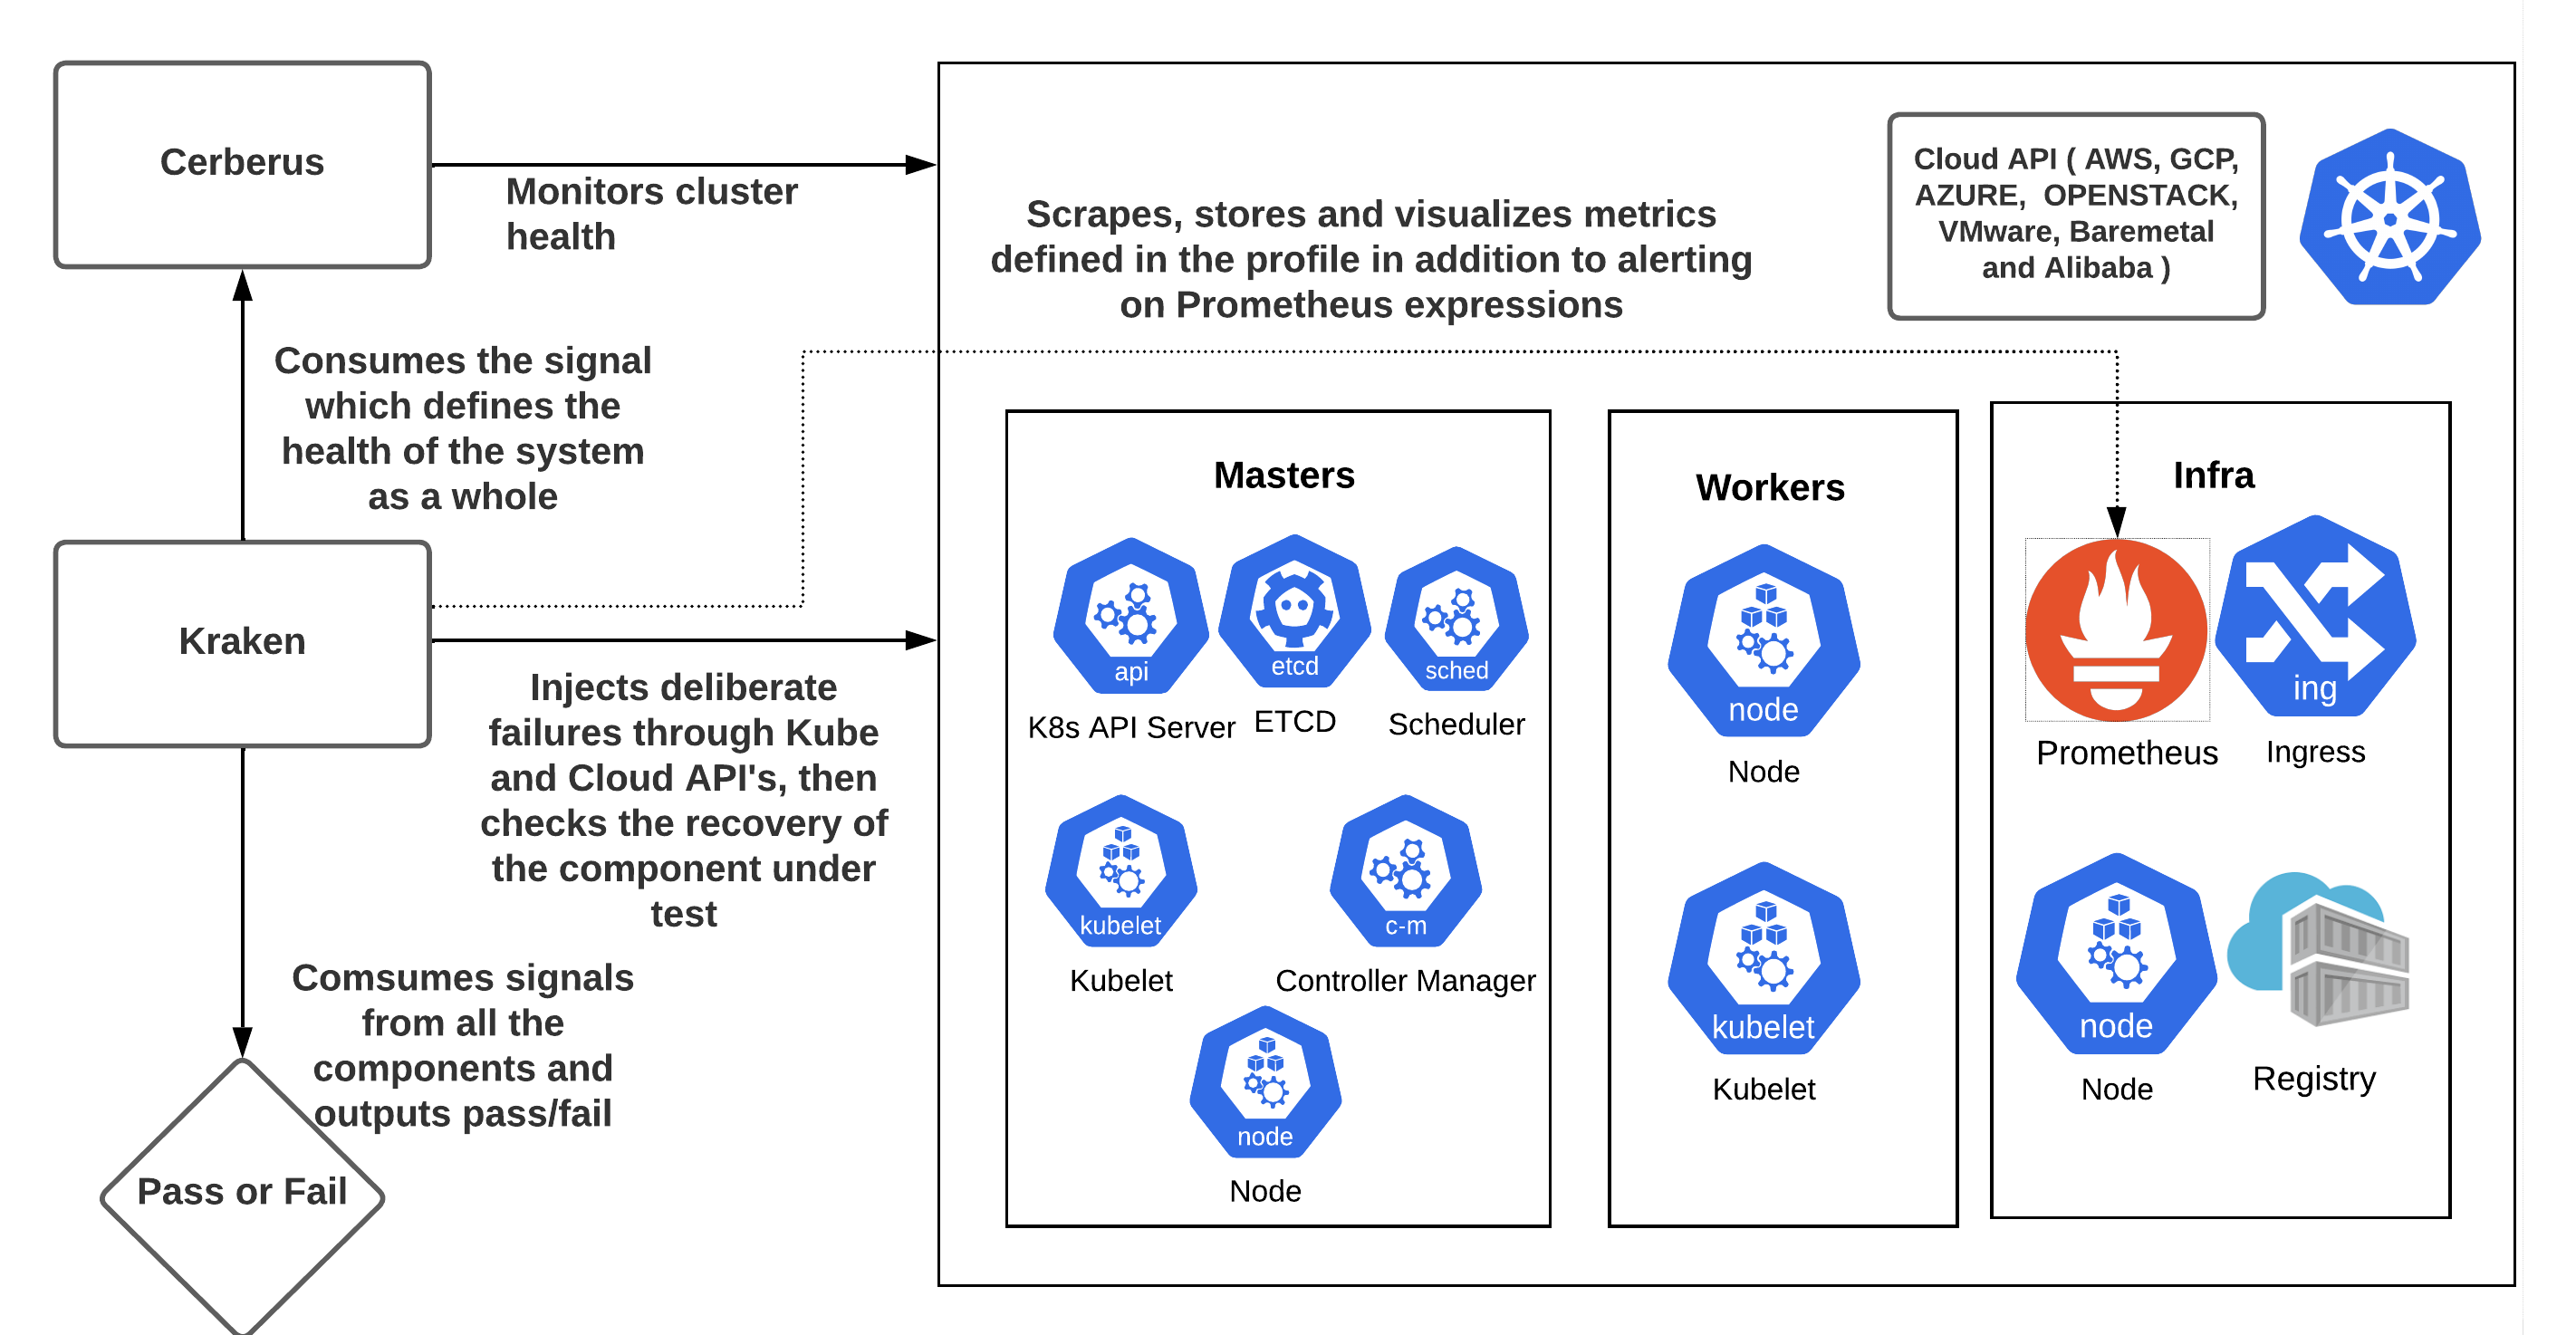
krkn is a chaos and resiliency testing tool for Kubernetes. Krkn injects deliberate failures into Kubernetes clusters to check if it is resilient to turbulent conditions.
Use Case and Target Personas
Krkn is designed for the following user roles:
- Site Reliability Engineers aiming to enhance the resilience and reliability of the Kubernetes platform and the applications it hosts. They also seek to establish a testing pipeline that ensures managed services adhere to best practices, minimizing the risk of prolonged outages.
- Developers and Engineers focused on improving the performance and robustness of their application stack when operating under failure scenarios.
- Kubernetes Administrators responsible for ensuring that onboarded services comply with established best practices to prevent extended downtime.
Workflow
How to Get Started
Instructions on how to setup, configure and run Krkn can be found at Installation.
You may consider utilizing the chaos recommendation tool prior to initiating the chaos runs to profile the application service(s) under test. This tool discovers a list of Krkn scenarios with a high probability of causing failures or disruptions to your application service(s). The tool can be accessed at Chaos-Recommender.
See the getting started doc on support on how to get started with your own custom scenario or editing current scenarios for your specific usage.
After installation, refer back to the below sections for supported scenarios and how to tweak the Krkn config to load them on your cluster.
Running Krkn with minimal configuration tweaks
For cases where you want to run Krkn with minimal configuration changes, refer to krkn-hub. One use case is CI integration where you do not want to carry around different configuration files for the scenarios.
Config
Instructions on how to setup the config and the options supported can be found at Config.
Krkn scenario pass/fail criteria and report
It is important to check if the targeted component recovered from the chaos injection and if the Kubernetes cluster is healthy, since failures in one component can have an adverse impact on other components. Krkn does this by:
- Having built in checks for pod and node based scenarios to ensure the expected number of replicas and nodes are up. It also supports running custom scripts with the checks.
- Leveraging Cerberus to monitor the cluster under test and consuming the aggregated go/no-go signal to determine pass/fail post chaos.
- It is highly recommended to turn on the Cerberus health check feature available in Krkn. Instructions on installing and setting up Cerberus can be found here or can be installed from Krkn using the instructions.
- Once Cerberus is up and running, set cerberus_enabled to True and cerberus_url to the url where Cerberus publishes go/no-go signal in the Krkn config file.
- Cerberus can monitor application routes during the chaos and fails the run if it encounters downtime as it is a potential downtime in a customers or users environment.
- It is especially important during the control plane chaos scenarios including the API server, Etcd, Ingress, etc.
- It can be enabled by setting
check_application_routes: True in the Krkn config provided application routes are being monitored in the cerberus config.
- Leveraging built-in alert collection feature to fail the runs in case of critical alerts.
- See also: SLOs validation for more details on metrics and alerts
Fail test if certain metrics aren’t met at the end of the run
Krkn Features
Signaling
In CI runs or any external job it is useful to stop Krkn once a certain test or state gets reached. We created a way to signal to Krkn to pause the chaos or stop it completely using a signal posted to a port of your choice.
For example, if we have a test run loading the cluster running and Krkn separately running, we want to be able to know when to start/stop the Krkn run based on when the test run completes or when it gets to a certain loaded state
More detailed information on enabling and leveraging this feature can be found here.
Monitoring the Kubernetes/OpenShift cluster to observe the impact of Krkn chaos scenarios on various components is key to find out the bottlenecks. It is important to make sure the cluster is healthy in terms of both recovery and performance during and after the failure has been injected. Instructions on enabling it within the config can be found here.
SLOs validation during and post chaos
- In addition to checking the recovery and health of the cluster and components under test, Krkn takes in a profile with the Prometheus expressions to validate and alerts, exits with a non-zero return code depending on the severity set. This feature can be used to determine pass/fail or alert on abnormalities observed in the cluster based on the metrics.
- Krkn also provides ability to check if any critical alerts are firing in the cluster post chaos and pass/fail’s.
Information on enabling and leveraging this feature can be found here
Health Checks
Health checks provide real-time visibility into the impact of chaos scenarios on application availability and performance. The system periodically checks the provided URLs based on the defined interval and records the results in Telemetry. To read more about how to properly configure health checks in your krkn run and sample output see health checks document.
Telemetry
We gather some basic details of the cluster configuration and scenarios ran as part of a telemetry set of data that is printed off at the end of each krkn run. You can also opt in to the telemetry being stored in AWS S3 bucket or elasticsearch for long term storage. Find more details and configuration specifics here
Resiliency Scoring
We have a powerful feature to quantify your system’s stability during chaos experiments. The Resiliency Score is a percentage (0-100%) calculated from a weighted evaluation of SLOs firing in Prometheus. This moves beyond a simple pass/fail, giving you a clear, data-driven metric to track your resilience over time. Find a detailed explanation of the scoring algorithm and configuration options here.
OCM / ACM integration
Krkn supports injecting faults into Open Cluster Management (OCM) and Red Hat Advanced Cluster Management for Kubernetes (ACM) managed clusters through ManagedCluster Scenarios.
Where should I go next?
1 - Krkn Config Explanations
Krkn config field explanations
Config
Set the scenarios to inject and the tunings like duration to wait between each scenario in the config file located at config/config.yaml.
NOTE: config can be used if leveraging the automated way to install the infrastructure pieces.
Config components:
Kraken
This section defines scenarios and specific data to the chaos run
Distribution
The distribution is now automatically set based on some verification points. Depending on which distribution, either openshift or kubernetes other parameters will be automatically set.
The prometheus url/route and bearer token are automatically obtained in case of OpenShift, please be sure to set it when the distribution is Kubernetes.
Exit on failure
exit_on_failure: Exit when a post action check or cerberus run fails
Publish kraken status
Refer to signal.md for more details
publish_kraken_status: Can be accessed at http://0.0.0.0:8081 (or what signal_address and port you set in signal address section)
signal_state: State you want krkn to start at; will wait for the RUN signal to start running a chaos iteration. When set to PAUSE before running the scenarios
signal_address: Address to listen/post the signal state to
port: port to listen/post the signal state to
Chaos Scenarios
chaos_scenarios: List of different types of chaos scenarios you want to run with paths to their specific yaml file configurations.
Currently the scenarios are run one after another (in sequence) and will exit if one of the scenarios fail, without moving onto the next one. You can find more details on each scenario under the Scenario folder.
Chaos scenario types:
- pod_disruption_scenarios
- container_scenarios
- hog_scenarios
- node_scenarios
- time_scenarios
- cluster_shut_down_scenarios
- namespace_scenarios
- zone_outages
- application_outages
- pvc_scenarios
- network_chaos
- pod_network_scenarios
- service_disruption_scenarios
- service_hijacking_scenarios
- syn_flood_scenarios
Cerberus
Parameters to set for enabling of cerberus checks at the end of each executed scenario. The given url will pinged after the scenario and post action check have been completed for each scenario and iteration. Read more about what cerberus is here
cerberus_enabled: Enable it when cerberus is previously installed
cerberus_url: When cerberus_enabled is set to True, provide the url where cerberus publishes go/no-go signal
check_applicaton_routes: When enabled will look for application unavailability using the routes specified in the cerberus config and fails the run
prometheus_url: The prometheus url/route is automatically obtained in case of OpenShift, please set it when the distribution is Kubernetes.
prometheus_bearer_token: The bearer token is automatically obtained in case of OpenShift, please set it when the distribution is Kubernetes. This is needed to authenticate with prometheus.
uuid: Uuid for the run, a new random one is generated by default if not set. Each chaos run should have its own unique UUID
enable_alerts: True or False; Runs the queries specified in the alert profile and displays the info or exits 1 when severity=error
enable_metrics: True or False, capture metrics defined by the metrics profile
alert_profile: Path or URL to alert profile with the prometheus queries, see a sample of an alerts file of some preconfigured alerts we have set up and more documentation around it here
metrics_profile: Path or URL to metrics profile with the prometheus queries to capture certain metrics on, see more details around metrics on its documentation page
check_critical_alerts: True or False; When enabled will check prometheus for critical alerts firing post chaos. Read more about this functionality in SLOs validation
Resiliency
The resiliency scoring system evaluates your cluster’s health during chaos scenarios by checking Service Level Objectives (SLOs) against Prometheus metrics. See Resiliency Scoring for detailed information about the scoring algorithm and SLO configuration.
resiliency_run_mode: Determines how resiliency scoring operates. Options are:
standalone (default): Calculates the resiliency score and embeds it in the telemetry outputcontroller: Prints the resiliency report to stdout for krknctl integration (used when running under krknctl)disabled: Completely disables resiliency scoring
resiliency_file: Path to the YAML file containing SLO definitions. If not specified, defaults to the alert_profile setting from performance_monitoring, or config/alerts.yaml if neither is set. The file should contain a list of SLO definitions with Prometheus expressions. See Resiliency Scoring for examples of SLO definitions and custom weight configuration.
Example configuration:
resiliency:
  resiliency_run_mode: standalone
  resiliency_file: config/alerts.yaml
The resiliency scoring system supports:
- Default severity-based weights (critical = 3 points, warning = 1 point)
- Custom weights for individual SLOs to emphasize business-critical services
- Per-scenario scoring with weighted aggregation for multi-scenario runs
- Detailed breakdown reports showing which SLOs passed/failed
Elastic
We have enabled the ability to store telemetry, metrics and alerts into ElasticSearch based on the below keys and values.
enable_elastic: True or False; If true, the telemetry data will be stored in the telemetry_index defined below. Based on if value of performance_monitoring.enable_alerts and performance_monitoring.enable_metrics are true or false, alerts and metrics will be saved in addition to each of the indexes
verify_certs: True or False
elastic_url: The url of the ElasticeSearch where you want to store data
username: ElasticSearch username
password: ElasticSearch password
metrics_index: ElasticSearch index where you want to store the metrics details, the alerts captured are defined from the performance_monitoring.metrics_profile variable and can be captured based on value of performance_monitoring.enable_alenable_metricserts
alerts_index: ElasticSearch index where you want to store the alert details, the alerts captured are defined from the performance_monitoring.alert_profile variable and can be captured based on value of performance_monitoring.enable_alerts
telemetry_index: ElasticSearch index where you want to store the telemetry details
Tunings
wait_duration: Duration to wait between each chaos scenario
iterations: Number of times to execute the scenarios
daemon_mode: True or False; If true, iterations are set to infinity which means that the krkn will cause chaos forever and number of iterations is ignored
Telemetry
More details on the data captured in the telmetry and how to set up your own telemetry data storage can be found here
enabled: True or False, enable/disables the telemetry collection feature
api_url: https://ulnmf9xv7j.execute-api.us-west-2.amazonaws.com/production #telemetry service endpoint
username: Telemetry service username
password: Telemetry service password
prometheus_backup: True or False, enables/disables prometheus data collection
prometheus_namespace: Namespace where prometheus is deployed, only needed if distribution is kubernetes
prometheus_container_name: Name of the prometheus container name, only needed if distribution is kubernetes
prometheus_pod_name: Name of the prometheus pod, only needed if distribution is kubernetes
full_prometheus_backup: True or False, if is set to False only the /prometheus/wal folder will be downloaded.
backup_threads: Number of telemetry download/upload threads, default is 5
archive_path: Local path where the archive files will be temporarly stored, default is /tmp
max_retries: Maximum number of upload retries (if 0 will retry forever), defaulted to 0
run_tag: If set, this will be appended to the run folder in the bucket (useful to group the runs)
archive_size: The size of the prometheus data archive size in KB. The lower the size of archive is the higher the number of archive files will be produced and uploaded (and processed by backup_threads simultaneously). For unstable/slow connection is better to keep this value low increasing the number of backup_threads, in this way, on upload failure, the retry will happen only on the failed chunk without affecting the whole upload.
telemetry_group: If set will archive the telemetry in the S3 bucket on a folder named after the value, otherwise will use “default”
logs_backup: True
logs_filter_patterns: Way to filter out certain times from the logs
        - "(\\w{3}\\s\\d{1,2}\\s\\d{2}:\\d{2}:\\d{2}\\.\\d+).+"         # Sep 9 11:20:36.123425532
        - "kinit (\\d+/\\d+/\\d+\\s\\d{2}:\\d{2}:\\d{2})\\s+"          # kinit 2023/09/15 11:20:36 log
        - "(\\d{4}-\\d{2}-\\d{2}T\\d{2}:\\d{2}:\\d{2}\\.\\d+Z).+"      # 2023-09-15T11:20:36.123425532Z log
oc_cli_path: Optional, if not specified will be search in $PATH, default is /usr/bin/oc
events_backup: True or False, this will capture events that occurred during the chaos run. Will be saved to {archive_path}/events.json
Health Checks
Utilizing health check endpoints to observe application behavior during chaos injection, see more details about how this works and different ways to configure here
interval: Interval in seconds to perform health checks, default value is 2 seconds
config: Provide list of health check configurations for applications
url: Provide application endpoint
bearer_token: Bearer token for authentication if any
auth: Provide authentication credentials (username , password) in tuple format if any, ex:(“admin”,“secretpassword”)
exit_on_failure: If value is True exits when health check failed for application, values can be True/False
Virt Checks
Utilizing kube virt checks observe VMI’s ssh connection behavior during chaos injection, see more details about how this works and different ways to configure here
interval: Interval in seconds to perform virt checks, default value is 2 seconds
namespace: VMI Namespace, needs to be set or checks won’t be run
name: Provided VMI regex name to match on; optional, if left blank will find all names in namespace
only_failures: Boolean of whether to show all VMI’s failures and successful ssh connection (False), or only failure status’ (True)
disconnected: Boolean of how to try to connect to the VMIs; if True will use the ip_address to try ssh from within a node, if false will use the name and uses virtctl to try to connect; Default is False
ssh_node: If set, will be a backup way to ssh to a node. Will want to set to a node that isn’t targeted in chaos
node_names: List of node names to further filter down the VM’s, will only watch VMs with matching name in the given namespace that are running on node. Can put multiple by separating by a comma
Sample Config file
kraken:
    kubeconfig_path: ~/.kube/config                     # Path to kubeconfig
    exit_on_failure: False                                 # Exit when a post action scenario fails
    publish_kraken_status: True                            # Can be accessed at http://0.0.0.0:8081
    signal_state: RUN                                      # Will wait for the RUN signal when set to PAUSE before running the scenarios, refer docs/signal.md for more details
    signal_address: 0.0.0.0                                # Signal listening address
    port: 8081                                             # Signal port
    chaos_scenarios:
        # List of policies/chaos scenarios to load
        - hog_scenarios:
            - scenarios/kube/cpu-hog.yml
            - scenarios/kube/memory-hog.yml
            - scenarios/kube/io-hog.yml
        - application_outages_scenarios:
            - scenarios/openshift/app_outage.yaml
        - container_scenarios:                             # List of chaos pod scenarios to load
            - scenarios/openshift/container_etcd.yml
        - pod_network_scenarios:
              - scenarios/openshift/network_chaos_ingress.yml
              - scenarios/openshift/pod_network_outage.yml
        - pod_disruption_scenarios:
            - scenarios/openshift/etcd.yml
            - scenarios/openshift/regex_openshift_pod_kill.yml
            - scenarios/openshift/prom_kill.yml
            - scenarios/openshift/openshift-apiserver.yml
            - scenarios/openshift/openshift-kube-apiserver.yml
        - node_scenarios:                                  # List of chaos node scenarios to load
            - scenarios/openshift/aws_node_scenarios.yml
            - scenarios/openshift/vmware_node_scenarios.yml
            - scenarios/openshift/ibmcloud_node_scenarios.yml
        - time_scenarios:                                  # List of chaos time scenarios to load
            - scenarios/openshift/time_scenarios_example.yml
        - cluster_shut_down_scenarios:
            - scenarios/openshift/cluster_shut_down_scenario.yml
        - service_disruption_scenarios:
             - scenarios/openshift/regex_namespace.yaml
             - scenarios/openshift/ingress_namespace.yaml
        - zone_outages_scenarios:
            - scenarios/openshift/zone_outage.yaml
        - pvc_scenarios:
            - scenarios/openshift/pvc_scenario.yaml
        - network_chaos_scenarios:
            - scenarios/openshift/network_chaos.yaml
        - service_hijacking_scenarios:
              - scenarios/kube/service_hijacking.yaml
        - syn_flood_scenarios:
              - scenarios/kube/syn_flood.yaml

cerberus:
    cerberus_enabled: False                                # Enable it when cerberus is previously installed
    cerberus_url:                                          # When cerberus_enabled is set to True, provide the url where cerberus publishes go/no-go signal
    check_applicaton_routes: False                         # When enabled will look for application unavailability using the routes specified in the cerberus config and fails the run

performance_monitoring:
    deploy_dashboards: False                              # Install a mutable grafana and load the performance dashboards. Enable this only when running on OpenShift
    repo: "https://github.com/cloud-bulldozer/performance-dashboards.git"
    prometheus_url: ''                                      # The prometheus url/route is automatically obtained in case of OpenShift, please set it when the distribution is Kubernetes.
    prometheus_bearer_token:                              # The bearer token is automatically obtained in case of OpenShift, please set it when the distribution is Kubernetes. This is needed to authenticate with prometheus.
    uuid:                                                 # uuid for the run is generated by default if not set
    enable_alerts: False                                  # Runs the queries specified in the alert profile and displays the info or exits 1 when severity=error
    enable_metrics: False
    alert_profile: config/alerts.yaml                          # Path or URL to alert profile with the prometheus queries
    metrics_profile: config/metrics-report.yaml
    check_critical_alerts: False                          # When enabled will check prometheus for critical alerts firing post chaos
elastic:
    enable_elastic: False
    verify_certs: False
    elastic_url: ""                                         # To track results in elasticsearch, give url to server here; will post telemetry details when url and index not blank
    elastic_port: 32766
    username: "elastic"
    password: "test"
    metrics_index: "krkn-metrics"
    alerts_index: "krkn-alerts"
    telemetry_index: "krkn-telemetry"

tunings:
    wait_duration: 60                                      # Duration to wait between each chaos scenario
    iterations: 1                                          # Number of times to execute the scenarios
    daemon_mode: False                                     # Iterations are set to infinity which means that the kraken will cause chaos forever
telemetry:
    enabled: False                                           # enable/disables the telemetry collection feature
    api_url: https://ulnmf9xv7j.execute-api.us-west-2.amazonaws.com/production #telemetry service endpoint
    username: username                                      # telemetry service username
    password: password                                    # telemetry service password
    prometheus_backup: True                                 # enables/disables prometheus data collection
    prometheus_namespace: ""                                # namespace where prometheus is deployed (if distribution is kubernetes)
    prometheus_container_name: ""                           # name of the prometheus container name (if distribution is kubernetes)
    prometheus_pod_name: ""                                 # name of the prometheus pod (if distribution is kubernetes)
    full_prometheus_backup: False                           # if is set to False only the /prometheus/wal folder will be downloaded.
    backup_threads: 5                                       # number of telemetry download/upload threads
    archive_path: /tmp                                      # local path where the archive files will be temporarly stored
    max_retries: 0                                          # maximum number of upload retries (if 0 will retry forever)
    run_tag: ''                                             # if set, this will be appended to the run folder in the bucket (useful to group the runs)
    archive_size: 500000
    telemetry_group: ''                                     # if set will archive the telemetry in the S3 bucket on a folder named after the value, otherwise will use "default"
    # the size of the prometheus data archive size in KB. The lower the size of archive is
                                                            # the higher the number of archive files will be produced and uploaded (and processed by backup_threads
                                                            # simultaneously).
                                                            # For unstable/slow connection is better to keep this value low
                                                            # increasing the number of backup_threads, in this way, on upload failure, the retry will happen only on the
                                                            # failed chunk without affecting the whole upload.
    logs_backup: True
    logs_filter_patterns:
     - "(\\w{3}\\s\\d{1,2}\\s\\d{2}:\\d{2}:\\d{2}\\.\\d+).+"         # Sep 9 11:20:36.123425532
     - "kinit (\\d+/\\d+/\\d+\\s\\d{2}:\\d{2}:\\d{2})\\s+"          # kinit 2023/09/15 11:20:36 log
     - "(\\d{4}-\\d{2}-\\d{2}T\\d{2}:\\d{2}:\\d{2}\\.\\d+Z).+"      # 2023-09-15T11:20:36.123425532Z log
    oc_cli_path: /usr/bin/oc                                # optional, if not specified will be search in $PATH
    events_backup: True                                     # enables/disables cluster events collection

health_checks:                                              # Utilizing health check endpoints to observe application behavior during chaos injection.
    interval:                                               # Interval in seconds to perform health checks, default value is 2 seconds
    config:                                                 # Provide list of health check configurations for applications
        - url:                                              # Provide application endpoint
          bearer_token:                                     # Bearer token for authentication if any
          auth:                                             # Provide authentication credentials (username , password) in tuple format if any, ex:("admin","secretpassword")
          exit_on_failure:                                  # If value is True exits when health check failed for application, values can be True/False
kubevirt_checks:                                            # Utilizing virt check endpoints to observe ssh ability to VMI's during chaos injection.
    interval: 2                                             # Interval in seconds to perform virt checks, default value is 2 seconds
    namespace:                                              # Namespace where to find VMI's
    name:                                                   # Regex Name style of VMI's to watch; optional, if left blank will find all names in namespace
    only_failures: False                                    # Boolean of whether to show all VMI's failures and successful ssh connection (False), or only failure status' (True)
    ssh_node: ""                                      # If set, will be a backup way to ssh to a node. Will want to set to a node that isn't targeted in chaos
    node_names: ""                                    # List of node names to further filter down the VM's, will only watch VMs with matching name in the given namespace that are running on node. Can put multiple by separating by a comma
3 - Krkn RBAC
RBAC Authorization rules required to run Krkn scenarios.
RBAC Configurations
Krkn supports two types of RBAC configurations:
- Ns-Privileged RBAC: Provides namespace-scoped permissions for scenarios that only require access to resources within a specific namespace.
- Privileged RBAC: Provides cluster-wide permissions for scenarios that require access to cluster-level resources like nodes.
The examples below use placeholders such as target-namespace and krkn-namespace which should be replaced with your actual namespaces. The service account name krkn-sa is also a placeholder that you can customize.
RBAC YAML Files
Ns-Privileged Role
The ns-privileged role provides permissions limited to namespace-scoped resources:
apiVersion: rbac.authorization.k8s.io/v1
kind: Role
metadata:
  name: krkn-ns-privileged-role
  namespace: <target-namespace>
rules:
- apiGroups: [""]
  resources: ["pods", "services"]
  verbs: ["get", "list", "watch", "create", "delete"]
- apiGroups: ["apps"]
  resources: ["deployments", "statefulsets"]
  verbs: ["get", "list", "watch", "create", "delete"]
- apiGroups: ["batch"]
  resources: ["jobs"]
  verbs: ["get", "list", "watch", "create", "delete"]
Ns-Privileged RoleBinding
apiVersion: rbac.authorization.k8s.io/v1
kind: RoleBinding
metadata:
  name: krkn-ns-privileged-rolebinding
  namespace: <target-namespace>
subjects:
- kind: ServiceAccount
  name: <krkn-sa>
  namespace: <target-namespace>
roleRef:
  kind: Role
  name: krkn-ns-privileged-role
  apiGroup: rbac.authorization.k8s.io
Privileged ClusterRole
The privileged ClusterRole provides permissions for cluster-wide resources:
apiVersion: rbac.authorization.k8s.io/v1
kind: ClusterRole
metadata:
  name: krkn-privileged-clusterrole
rules:
- apiGroups: [""]
  resources: ["nodes"]
  verbs: ["get", "list", "watch", "create", "delete", "update", "patch"]
- apiGroups: [""]
  resources: ["pods", "services"]
  verbs: ["get", "list", "watch", "create", "delete", "update", "patch"]
- apiGroups: ["apps"]
  resources: ["deployments", "statefulsets"]
  verbs: ["get", "list", "watch", "create", "delete", "update", "patch"]
- apiGroups: ["batch"]
  resources: ["jobs"]
  verbs: ["get", "list", "watch", "create", "delete", "update", "patch"]
Privileged ClusterRoleBinding
apiVersion: rbac.authorization.k8s.io/v1
kind: ClusterRoleBinding
metadata:
  name: krkn-privileged-clusterrolebinding
subjects:
- kind: ServiceAccount
  name: <krkn-sa>
  namespace: <krkn-namespace>
roleRef:
  kind: ClusterRole
  name: krkn-privileged-clusterrole
  apiGroup: rbac.authorization.k8s.io
How to Apply RBAC Configuration
Customize the namespace in the YAML files:
- Replace
target-namespace with the namespace where you want to run Krkn scenarios - Replace
krkn-namespace with the namespace where Krkn itself is deployed
Create a service account for Krkn:
kubectl create serviceaccount krkn-sa -n <namespace>
- Apply the RBAC configuration:
# For ns-privileged access
kubectl apply -f rbac/ns-privileged-role.yaml
kubectl apply -f rbac/ns-privileged-rolebinding.yaml

# For privileged access
kubectl apply -f rbac/privileged-clusterrole.yaml
kubectl apply -f rbac/privileged-clusterrolebinding.yaml
OpenShift-specific Configuration
For OpenShift clusters, you may need to grant the privileged Security Context Constraint (SCC) to the service account:
oc adm policy add-scc-to-user privileged -z krkn-sa -n <namespace>
Krkn Scenarios and Required RBAC Permissions
The following table lists the available Krkn scenarios and their required RBAC permission levels:
| Scenario Type | Plugin Type | Required RBAC | Description |
|---|
| application_outages_scenarios | Namespace | Ns-Privileged | Scenarios that cause application outages |
| cluster_shut_down_scenarios | Cluster | Privileged | Scenarios that shut down the cluster |
| container_scenarios | Namespace | Ns-Privileged | Scenarios that affect containers |
| hog_scenarios | Cluster | Privileged | Scenarios that consume resources |
| network_chaos_scenarios | Cluster | Privileged | Scenarios that cause network chaos |
| network_chaos_ng_scenarios | Cluster | Privileged | Next-gen network chaos scenarios |
| node_scenarios | Cluster | Privileged | Scenarios that affect nodes |
| pod_disruption_scenarios | Namespace | Ns-Privileged | Scenarios that disrupt or kill pods |
| pod_network_scenarios | Namespace | Ns-Privileged | Scenarios that affect pod network connectivity |
| pvc_scenarios | Namespace | Ns-Privileged | Scenarios that affect persistent volume claims |
| service_disruption_scenarios | Namespace | Ns-Privileged | Scenarios that disrupt services |
| service_hijacking_scenarios | Namespace | Privileged | Scenarios that hijack services |
| syn_flood_scenarios | Cluster | Privileged | SYN flood attack scenarios |
| time_scenarios | Cluster | Privileged | Scenarios that manipulate system time |
| zone_outages_scenarios | Cluster | Privileged | Scenarios that simulate zone outages |
NOTE: Grant the privileged SCC to the user running the pod, to execute all the below krkn testscenarios
oc adm policy add-scc-to-user privileged user1
5 - Kube Virt Checks
Kube Virt Checks to analyze down times of VMIs
Kube Virt Checks
Virt checks provide real-time visibility into the impact of chaos scenarios on VMI ssh connectivity and performance.
Virt checks are configured in the config.yaml here
The system periodically checks the VMI’s in the provided namespace based on the defined interval and records the results in Telemetry. The checks will run continuously from the very beginning of krkn until all scenarios are done and wait durations are complete. The telemetry data includes:
- Success status
True when the VMI is up and running and can form an ssh connection - Failure response
False if the VMI experiences downtime or errors. - The VMI Name
- The VMI Namespace
- The VMI Ip Address and a New IP Address if the VMI is deleted
- The time of the start and end of the specific status
- The duration the VMI had the specific status
- The node the VMI is running on
This helps users quickly identify VMI issues and take necessary actions.
Additional Installation of VirtCtl (If running using Krkn)
It is required to have virtctl or an ssh connection via a bastion host to be able to run this option. We don’t recommend using the krew installation type.
This is only required if you are running locally with python Krkn version, the virtctl command will be automatically installed in the krkn-hub and krknctl images
See virtctl installer guide from KubeVirt
VERSION=$(curl https://storage.googleapis.com/kubevirt-prow/release/kubevirt/kubevirt/stable.txt)
ARCH=$(uname -s | tr A-Z a-z)-$(uname -m | sed 's/x86_64/amd64/') || windows-amd64.exe
echo ${ARCH}
curl -L -o virtctl https://github.com/kubevirt/kubevirt/releases/download/${VERSION}/virtctl-${VERSION}-${ARCH}
chmod +x virtctl
sudo install virtctl /usr/local/bin
Sample health check config
kubevirt_checks:                                      # Utilizing virt check endpoints to observe ssh ability to VMI's during chaos injection.
    interval: 2                                       # Interval in seconds to perform virt checks, default value is 2 seconds, required
    namespace: runner                                 # Regex Namespace where to find VMI's, required for checks to be enabled
    name: "^windows-vm-.$"                            # Regex Name style of VMI's to watch, optional, if left blank will find all names in namespace
    only_failures: False                              # Boolean of whether to show all VMI's failures and successful ssh connection (False), or only failure status' (True)
    disconnected: False                               # Boolean of how to try to connect to the VMIs; if True will use the ip_address to try ssh from within a node, if false will use the name and uses virtctl to try to connect
    ssh_node: ""                                      # If set, will be a backup way to ssh to a node. Will want to set to a node that isn't targeted in chaos
    node_names: ""                                    # List of node names to further filter down the VM's, will only watch VMs with matching name in the given namespace that are running on node. Can put multiple by separating by a comma
    exit_on_failure:                                        # If value is True and VMI's are failing post chaos returns failure, values can be True/False
Disconnected Environment
The disconnected variable set in the config bypasses the kube-apiserver and SSH’s directly to the worker nodes to test SSH connection to the VM’s IP address.
When using disconnected: true, you must configure SSH authentication to the worker nodes. This requires passing your SSH private key to the container.
Configuration:
disconnected: True # Boolean of how to try to connect to the VMIs; if True will use the ip_address to try ssh from within a node, if false will use the name and uses virtctl to try to connect
SSH Key Setup for krkn-hub or krknctl:
You need to mount your SSH private and/or public key into the container to enable SSH connection to the worker nodes. Pass the id_rsa variable with the path to your SSH keys:
# Example with krknctl
krknctl run --config config.yaml -e id_rsa=/path/to/your/id_rsa

# Example with krkn-hub
podman run --name=<container_name> --net=host \
  -v /path/to/your/id_rsa:/home/krkn/.ssh/id_rsa:Z \. # do not change path on right of colon
  -v /path/to/your/id_rsa.pub:/home/krkn/.ssh/id_rsa.pub:Z \. # do not change path on right of colon
  -v /path/to/config.yaml:/root/kraken/config/config.yaml:Z \
  -d quay.io/krkn-chaos/krkn-hub:<scenario_type>
Note: Ensure your SSH key has appropriate permissions (chmod 644 id_rsa) and matches the key authorized on your worker nodes.
Post Virt Checks
After all scenarios have finished executing, krkn will perform a final check on the VMs matching the specified namespace and name. It will attempt to reach each VM and provide a list of any that are still unreachable at the end of the run. The list can be seen in the telemetry details at the end of the run.
Sample virt check telemetry
Notice here that the vm with name windows-vm-1 had a false status (not able to form an ssh connection), for the first 37 seconds (the first item in the list). And at the end of the run the vm was able to for the ssh connection and reports true status for 41 seconds. While the vm with name windows-vm-0 has a true status the whole length of the chaos run (~88 seconds).
"virt_checks": [
      {
          "node_name": "000-000",
          "namespace": "runner",
          "vm_name": "windows-vm-1",
          "ip_address": "0.0.0.0",
          "status": false,
          "start_timestamp": "2025-07-22T13:41:53.461951",
          "end_timestamp": "2025-07-22T13:42:30.696498",
          "duration": 37.234547,
          "new_ip_address": "0.0.0.2",
      },
      {
          "node_name": "000-000",
          "namespace": "runner",
          "vm_name": "windows-vm-0",
          "ip_address": "0.0.0.1",
          "status": true,
          "start_timestamp": "2025-07-22T13:41:49.346861",
          "end_timestamp": "2025-07-22T13:43:17.949613",
          "duration": 88.602752,
          "new_ip_address": ""
      },
      {
          "node_name": "000-000",
          "namespace": "runner",
          "vm_name": "windows-vm-1",
          "ip_address": "0.0.0.2",
          "status": true,
          "start_timestamp": "2025-07-22T13:42:36.260780",
          "end_timestamp": "2025-07-22T13:43:17.949613",
          "duration": 41.688833,
          "new_ip_address": ""
      }
  ],
"post_virt_checks": [
      {
          "node_name": "000-000",
          "namespace": "runner",
          "vm_name": "windows-vm-4",
          "ip_address": "0.0.0.3",
          "status": false,
          "start_timestamp": "2025-07-22T13:43:30.461951",
          "end_timestamp": "2025-07-22T13:43:30.461951",
          "duration": 0.0,
          "new_ip_address": "",
      }
]
6 - Resiliency Scoring
Resiliency Scoring Calculation Algorithm and Configuration
Beta Feature: Resiliency Scoring is currently in Beta. The API, configuration format, and scoring behavior may change in future releases.
If you encounter any issues or unexpected behavior, please open a bug report at github.com/krkn-chaos/krkn/issues. Include your configuration, krkn version, and any relevant logs or output.
Introduction
What is the Resiliency Score?
The Resiliency Score is a percentage (0-100%) that represents the health and stability of your Kubernetes cluster during a chaos scenario. It is calculated by evaluating a set of Service Level Objectives (SLOs) against live Prometheus data.
Why use it?
A simple pass or fail doesn’t tell the whole story. A score of 95% indicates a robust system with minor degradation, while a score of 60% reveals significant issues that need investigation, even if the chaos scenario technically “passed”. This allows you to track resilience improvements over time and make data-driven decisions.
How does it work?
After a chaos scenario completes, Krkn evaluates a list of pre-defined SLOs (which are Prometheus alert expressions) over the chaos time window. It counts how many SLOs passed and failed, applies a weighted scoring model, and embeds a detailed report in the final telemetry output.
The Scoring Algorithm
The final score is calculated using a weighted pass/fail model. By default, weights are based on SLO severity, but you can also assign custom weights to individual SLOs for more granular control.
SLO Severity and Default Weights
Each SLO is assigned a severity of either warning or critical:
- Warning: Represents performance degradation or minor issues. Worth 1 point by default.
- Critical: Represents significant service impairment or outages. Worth 3 points by default.
Custom Weights
In addition to severity-based weighting, you can assign a custom weight to any individual SLO. This allows you to fine-tune the scoring model based on your specific requirements. When a custom weight is specified, it overrides the default severity-based weight for that SLO.
Use cases for custom weights:
- Emphasize business-critical SLOs beyond standard severity levels
- De-emphasize less important warnings
- Create custom scoring profiles for different environments or use cases
The score is calculated as a percentage of the total possible points achieved.
Score % = ((Total Points - Points Lost) / Total Points) * 100
Where:
- Total Points: The sum of weights for all evaluated SLOs (either custom weight or severity-based weight).
- Points Lost: The sum of weights for all failed SLOs.
Example Calculation (Severity-based):
- Profile: 5 critical SLOs, 15 warning SLOs.
- Total Possible Points:
(5 * 3) + (15 * 1) = 30. - Chaos Outcome: 1 critical SLO and 4 warning SLOs failed.
- Points Lost:
(1 * 3) + (4 * 1) = 7. - Final Score:
((30 - 7) / 30) * 100 = 76.6%.
Example Calculation (With Custom Weights):
- Profile: 3 SLOs with custom weights (10, 5, 2), 2 critical SLOs (default weight 3 each).
- Total Possible Points:
10 + 5 + 2 + (2 * 3) = 23. - Chaos Outcome: The SLO with weight 10 failed, and 1 critical SLO failed.
- Points Lost:
10 + 3 = 13. - Final Score:
((23 - 13) / 23) * 100 = 43.5%.
Defining SLOs with Custom Weights
SLOs are defined in the alerts YAML file (typically config/alerts.yaml). The format supports both the traditional severity-only format and an extended format with custom weights.
- expr: avg_over_time(histogram_quantile(0.99, rate(etcd_disk_wal_fsync_duration_seconds_bucket[2m]))[10m:]) > 0.01
  description: 10 minutes avg. 99th etcd fsync latency higher than 10ms
  severity: warning

- expr: etcd_server_has_leader{job=~".*etcd.*"} == 0
  description: etcd cluster has no leader
  severity: critical
In this format, the weight is automatically determined by severity: critical = 3 points, warning = 1 point.
- expr: avg_over_time(histogram_quantile(0.99, rate(etcd_disk_wal_fsync_duration_seconds_bucket[2m]))[10m:]) > 0.01
  description: 10 minutes avg. 99th etcd fsync latency higher than 10ms
  severity: warning
  weight: 5

- expr: etcd_server_has_leader{job=~".*etcd.*"} == 0
  description: etcd cluster has no leader
  severity: critical
  weight: 10
In this format, you specify an explicit weight value that overrides the default severity-based weight. The severity field is still required for classification purposes.
You can mix both formats in the same file:
# Business-critical SLO with custom high weight
- expr: up{job="payment-service"} == 0
  description: Payment service is down
  severity: critical
  weight: 15

# Standard critical SLO (uses default weight of 3)
- expr: etcd_server_has_leader{job=~".*etcd.*"} == 0
  description: etcd cluster has no leader
  severity: critical

# Low-priority warning with reduced weight
- expr: node_filesystem_free_bytes{mountpoint="/"} / node_filesystem_size_bytes < 0.1
  description: Root filesystem less than 10% free
  severity: warning
  weight: 0.5

# Standard warning (uses default weight of 1)
- expr: rate(http_requests_total{code="500"}[5m]) > 0.01
  description: High rate of 500 errors
  severity: warning
Configuration
The resiliency scoring system can be configured in your Krkn configuration file (config/config.yaml). If no resiliency section is specified, Krkn will automatically run in standalone mode and use the alerts file defined under performance_monitoring: - alert_profile: <alerts.yaml>.
resiliency:
  resiliency_run_mode: standalone  # Options: standalone, controller, disabled
  resiliency_file: config/alerts.yaml  # Path to SLO definitions
Configuration Options:
resiliency_run_mode: Determines how resiliency scoring operates
standalone (default): Calculates score and embeds in telemetry outputcontroller: Prints resiliency report to stdout for krknctl integrationdisabled: Disables resiliency scoring
resiliency_file: Path to the YAML file containing SLO definitions. If not specified, defaults to the alert_profile setting from performance_monitoring, or config/alerts.yaml if neither is set.
Execution Modes
Krkn supports three execution modes:
Mode 1: Standalone (Default)
Uses config/alerts.yaml or the file specified in configuration.
- Runs the chaos scenario.
- Loads SLO definitions from the alerts file.
- Evaluates each SLO against Prometheus over the chaos time window.
- Calculates the score and writes an overview into
kraken.report and the full report in resiliency-report.json.
Example telemetry snippet:
{
  "telemetry": {
    "run_uuid": "717c8135-2aa0-47c9-afdf-3a6fe855c535",
    "job_status": false,
    "overall_resiliency_report": {
            "scenarios": {
                "<scenario_1>": 97,
                "<scenario_2>": 97
            },
            "resiliency_score": 97,
            "passed_slos": 26,
            "total_slos": 27
        },
  }
}
Example resiliency-report snippet:
{
  "scenarios": [
    {
      "name": "<scenario_1>",
      "window": {
        "start": "2026-03-18T15:36:14",
        "end": "2026-03-18T15:36:25"
      },
      "score": 97,
      "weight": 1,
      "breakdown": {
        "total_points": 45,
        "points_lost": 1,
        "passed": 26,
        "failed": 1
      },
      "slo_results": {
        "10 minutes avg. 99th etcd fsync latency on {{$labels.pod}} higher than 10ms. {{$value}}s": true,
        ...
      },
      "health_check_results": {}
    },
    {
      "name": "<scenario_2>",
      "window": {
        "start": "2026-03-18T15:36:27",
        "end": "2026-03-18T15:37:19"
      },
      "score": 97,
      "weight": 1,
      "breakdown": {
        "total_points": 45,
        "points_lost": 1,
        "passed": 26,
        "failed": 1
      },
      "slo_results": {
        "10 minutes avg. 99th etcd fsync latency on {{$labels.pod}} higher than 10ms. {{$value}}s": true,
        ...
      },
      "health_check_results": {}
    }
  ]
}
Mode 2: Controller (krknctl integration)
Activated by setting resiliency_run_mode: controller in configuration.
- Krkn runs inside a container launched by krknctl.
- After scoring, it prints a detailed JSON report prefixed with
KRKN_RESILIENCY_REPORT_JSON:. - krknctl captures this output and aggregates scores across multiple scenarios.
Example stdout snippet:
2025-11-10 10:30:05 [INFO] Resiliency check complete. Score: 76.6%
KRKN_RESILIENCY_REPORT_JSON:{"scenarios":[{"name":"node-cpu-hog","score":76,"weight":1.0,"breakdown":{"total_points":30,"points_lost":7,"passed":18,"failed":2}}]}
For multi-scenario runs with per-scenario weighting and parallel execution, use krknctl.
Architecture and Implementation
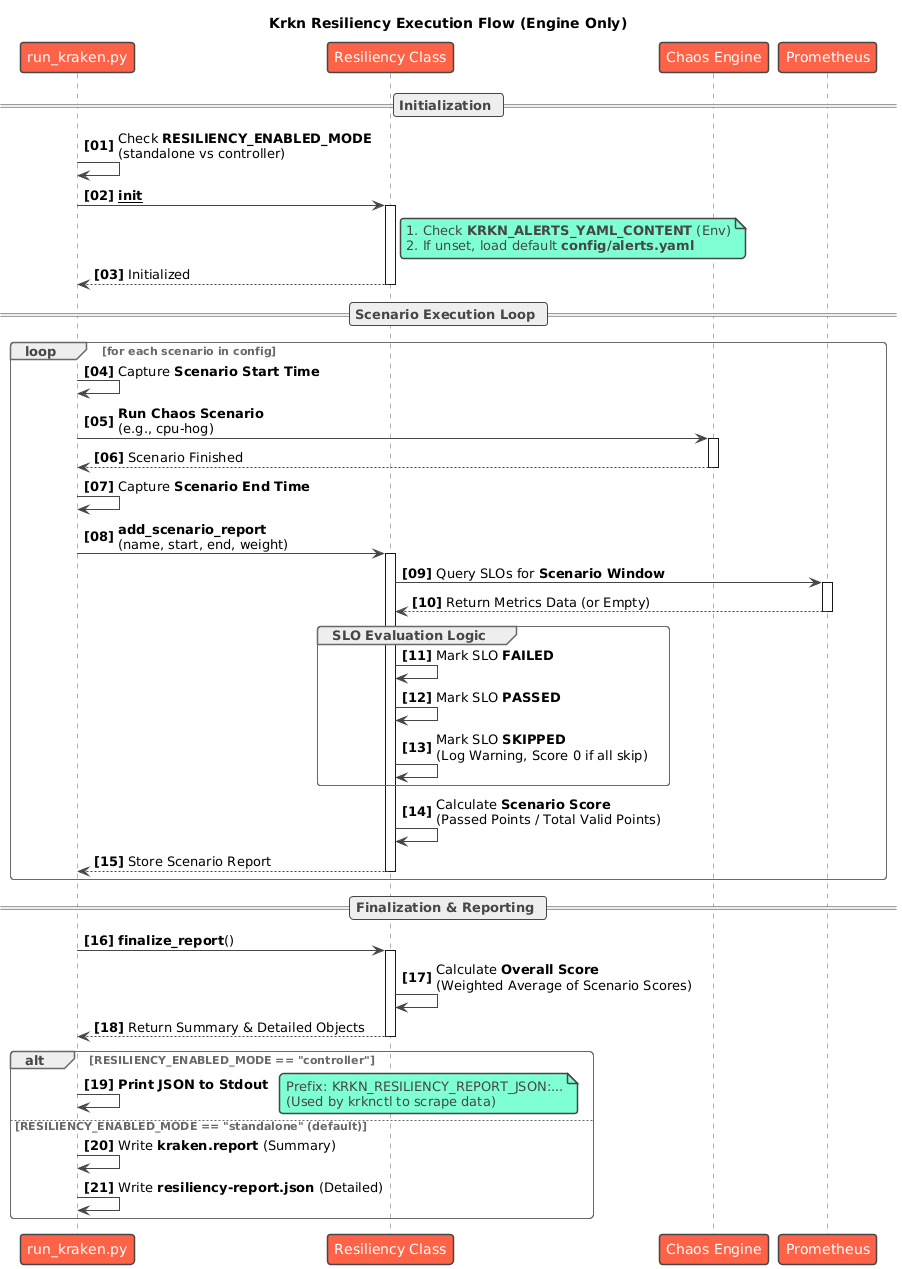
A single Resiliency class in krkn/resiliency/resiliency.py manages the entire lifecycle:
Initialization
- Loads SLO definitions from the alerts YAML file
- Parses both traditional (severity-only) and extended (with custom weights) formats
- Detects the execution mode from configuration
Evaluation
- Iterates through each SLO and executes its Prometheus
expr query over the chaos time window - Uses the
evaluate_slos() function from krkn/prometheus/collector.py
Result Mapping
- A non-empty query result marks the SLO as failed
- An empty result marks it as passed
- SLOs that return no data from Prometheus are excluded from scoring
Scoring
- For each SLO, determines the weight: uses custom weight if specified, otherwise uses severity-based weight (critical = 3, warning = 1)
- Calculates total points and points lost
- Derives the percentage score using the formula above
Reporting
- Standalone mode: Embeds the report into telemetry and writes to
kraken.report - Controller mode: Serializes the report to JSON and prints with the
KRKN_RESILIENCY_REPORT_JSON: prefix for krknctl consumption
Scenario-based Resiliency Scoring
For multi-scenario chaos runs, Krkn supports per-scenario resiliency scoring with weighted aggregation:
- Each scenario gets its own resiliency score calculated over its specific time window
- Each scenario can have a weight assigned (default: 1.0)
- The final resiliency score is a weighted average of all scenario scores
Weighted Average Formula:
Final Score = Σ(scenario_score × scenario_weight) / Σ(scenario_weight)
This allows you to prioritize certain scenarios over others when calculating the overall resiliency score for a chaos run.
Best Practices
Start with Severity-based Weights: Use the default severity-based weights (critical=3, warning=1) as a baseline.
Apply Custom Weights Strategically: Only use custom weights for SLOs that truly warrant special attention:
- Business-critical services that require higher weight than standard critical SLOs
- Low-impact warnings that should have minimal effect on the score
Document Your Weighting Decisions: Add comments in your alerts.yaml to explain why specific custom weights were chosen.
Test Your Scoring Profile: Run chaos scenarios and review the resulting scores to ensure your weighting model reflects your actual priorities.
Version Control Your Alerts: Keep your alerts.yaml in version control and track changes to your SLO definitions and weights over time.
Use Consistent Weight Scales: If using custom weights, maintain a consistent scale (e.g., 1-20) to make weights comparable across SLOs.
Example: Complete Alerts Profile with Custom Weights
# Business-critical: Payment processing must stay available
- expr: up{job="payment-api"} == 0
  description: Payment API is completely down
  severity: critical
  weight: 20

# Business-critical: Core authentication service
- expr: up{job="auth-service"} == 0
  description: Authentication service is down
  severity: critical
  weight: 15

# Standard critical: etcd cluster health (uses default weight of 3)
- expr: etcd_server_has_leader{job=~".*etcd.*"} == 0
  description: etcd cluster has no leader
  severity: critical

# High-priority warning: API latency
- expr: histogram_quantile(0.99, sum(rate(http_request_duration_seconds_bucket[5m])) by (le)) > 1
  description: 99th percentile API latency exceeds 1s
  severity: warning
  weight: 5

# Standard warning: Disk space (uses default weight of 1)
- expr: node_filesystem_avail_bytes{mountpoint="/"} / node_filesystem_size_bytes < 0.2
  description: Root filesystem less than 20% free
  severity: warning

# Low-priority informational warning
- expr: rate(http_requests_total{code=~"4.."}[5m]) > 10
  description: High rate of client errors
  severity: warning
  weight: 0.5
In this example:
- Payment API downtime has the highest weight (20 points)
- Auth service downtime is also critical but slightly less weighted (15 points)
- Standard etcd health uses the default critical weight (3 points)
- API latency warnings are more important than standard warnings (5 points vs 1 point)
- Client error warnings have reduced impact (0.5 points)
This creates a scoring model that heavily emphasizes business-critical services while still accounting for platform stability and performance issues.
7 - Signaling to Krkn
Signal to stop/start/pause krkn
This functionality allows a user to be able to pause or stop the Krkn run at any time no matter the number of iterations or daemon_mode set in the config.
If publish_kraken_status is set to True in the config, Krkn will start up a connection to a url at a certain port to decide if it should continue running.
By default, it will get posted to http://0.0.0.0:8081/
An example use case for this feature would be coordinating Krkn runs based on the status of the service installation or load on the cluster.
States
There are 3 states in the Krkn status:
PAUSE: When the Krkn signal is ‘PAUSE’, this will pause the Krkn test and wait for the wait_duration until the signal returns to RUN.
STOP: When the Krkn signal is ‘STOP’, end the Krkn run and print out report.
RUN: When the Krkn signal is ‘RUN’, continue Krkn run based on iterations.
Configuration
In the config you need to set these parameters to tell Krkn which port to post the Krkn run status to.
As well if you want to publish and stop running based on the Krkn status or not.
The signal is set to RUN by default, meaning it will continue to run the scenarios. It can set to PAUSE for Krkn to act as listener and wait until set to RUN before injecting chaos.
    port: 8081
    publish_kraken_status: True
    signal_state: RUN
Setting Signal
You can reset the Krkn status during Krkn execution with a set_stop_signal.py script with the following contents:
import http.client as cli

conn = cli.HTTPConnection("0.0.0.0", "<port>")

conn.request("POST", "/STOP", {})

# conn.request('POST', '/PAUSE', {})

# conn.request('POST', '/RUN', {})

response = conn.getresponse()
print(response.read().decode())
Make sure to set the correct port number in your set_stop_signal script.
Url Examples
To stop run:
curl -X POST http:/0.0.0.0:8081/STOP
To pause run:
curl -X POST http:/0.0.0.0:8081/PAUSE
To start running again:
curl -X POST http:/0.0.0.0:8081/RUN
8 - SLO Validation
Validation points in krkn
SLOs validation
Krkn has a few different options that give a Pass/fail based on metrics captured from the cluster is important in addition to checking the health status and recovery. Krkn supports:
Checking for critical alerts post chaos
If enabled, the check runs at the end of each scenario ( post chaos ) and Krkn exits in case critical alerts are firing to allow user to debug. You can enable it in the config:
performance_monitoring:
    check_critical_alerts: False                          # When enabled will check prometheus for critical alerts firing post chaos
Validation and alerting based on the queries defined by the user during chaos
Takes PromQL queries as input and modifies the return code of the run to determine pass/fail. It’s especially useful in case of automated runs in CI where user won’t be able to monitor the system. This feature can be enabled in the config by setting the following:
performance_monitoring:
    prometheus_url:                                       # The prometheus url/route is automatically obtained in case of OpenShift, please set it when the distribution is Kubernetes.
    prometheus_bearer_token:                              # The bearer token is automatically obtained in case of OpenShift, please set it when the distribution is Kubernetes. This is needed to authenticate with prometheus.
    enable_alerts: True                                   # Runs the queries specified in the alert profile and displays the info or exits 1 when severity=error.
    alert_profile: config/alerts.yaml                          # Path to alert profile with the prometheus queries.
Alert profile
A couple of alert profiles alerts are shipped by default and can be tweaked to add more queries to alert on. User can provide a URL or path to the file in the config. The following are a few alerts examples:
- expr: avg_over_time(histogram_quantile(0.99, rate(etcd_disk_wal_fsync_duration_seconds_bucket[2m]))[5m:]) > 0.01
  description: 5 minutes avg. etcd fsync latency on {{$labels.pod}} higher than 10ms {{$value}}
  severity: error

- expr: avg_over_time(histogram_quantile(0.99, rate(etcd_network_peer_round_trip_time_seconds_bucket[5m]))[5m:]) > 0.1
  description: 5 minutes avg. etcd network peer round trip on {{$labels.pod}} higher than 100ms {{$value}}
  severity: info

- expr: increase(etcd_server_leader_changes_seen_total[2m]) > 0
  description: etcd leader changes observed
  severity: critical
Krkn supports setting the severity for the alerts with each one having different effects:
info: Prints an info message with the alarm description to stdout. By default all expressions have this severity.
warning: Prints a warning message with the alarm description to stdout.
error: Prints a error message with the alarm description to stdout and sets Krkn rc = 1
critical: Prints a fatal message with the alarm description to stdout and exits execution inmediatly with rc != 0
Metrics Profile
A couple of metric profiles, metrics.yaml, and metrics-aggregated.yaml are shipped by default and can be tweaked to add more metrics to capture during the run. The following are the API server metrics for example:
metrics:
# API server
  - query: histogram_quantile(0.99, sum(rate(apiserver_request_duration_seconds_bucket{apiserver="kube-apiserver", verb!~"WATCH", subresource!="log"}[2m])) by (verb,resource,subresource,instance,le)) > 0
    metricName: API99thLatency

  - query: sum(irate(apiserver_request_total{apiserver="kube-apiserver",verb!="WATCH",subresource!="log"}[2m])) by (verb,instance,resource,code) > 0
    metricName: APIRequestRate

  - query: sum(apiserver_current_inflight_requests{}) by (request_kind) > 0
    metricName: APIInflightRequests
9 - Telemetry
Telemetry run details of the cluster and scenario
Telemetry Details
We wanted to gather some more insights regarding our Krkn runs that could have been post processed (eg. by a ML model) to have a better understanding about the behavior of the clusters hit by krkn, so we decided to include this as an opt-in feature that, based on the platform (Kubernetes/OCP), is able to gather different type of data and metadata in the time frame of each chaos run.
The telemetry service is currently able to gather several scenario and cluster metadata:
A json named telemetry.json containing:
- Chaos run metadata:
- the duration of the chaos run
- the config parameters with which the scenario has been setup
- any recovery time details (applicable to pod scenarios and node scenarios only)
- the exit status of the chaos run
- Cluster metadata:
- Node metadata (architecture, cloud instance type etc.)
- Node counts
- Number and type of objects deployed in the cluster
- Network plugins
- Cluster version
- A partial/full backup of the prometheus binary logs (currently available on OCP only)
- Any firing critical alerts on the cluster
Deploy your own telemetry AWS service
The krkn-telemetry project aims to provide a basic, but fully working example on how to deploy your own Krkn telemetry collection API. We currently do not support the telemetry collection as a service for community users and we discourage to handover your infrastructure telemetry metadata to third parties since may contain confidential infos.
The guide below will explain how to deploy the service automatically as an AWS lambda function, but you can easily deploy it as a flask application in a VM or in any python runtime environment. Then you can use it to store data to use in chaos-ai
https://github.com/krkn-chaos/krkn-telemetry
Sample telemetry config
telemetry:
    enabled: False                                           # enable/disables the telemetry collection feature
    api_url: https://ulnmf9xv7j.execute-api.us-west-2.amazonaws.com/production #telemetry service endpoint
    username: username                                      # telemetry service username
    password: password                                      # telemetry service password
    prometheus_backup: True                                 # enables/disables prometheus data collection
    full_prometheus_backup: False                           # if is set to False only the /prometheus/wal folder will be downloaded.
    backup_threads: 5                                       # number of telemetry download/upload threads
    archive_path: /tmp                                      # local path where the archive files will be temporarly stored
    max_retries: 0                                          # maximum number of upload retries (if 0 will retry forever)
    run_tag: ''                                             # if set, this will be appended to the run folder in the bucket (useful to group the runs)
    archive_size: 500000                                     # the size of the prometheus data archive size in KB. The lower the size of archive is
                                                            # the higher the number of archive files will be produced and uploaded (and processed by backup_threads
                                                            # simultaneously).
                                                            # For unstable/slow connection is better to keep this value low
                                                            # increasing the number of backup_threads, in this way, on upload failure, the retry will happen only on the
                                                            # failed chunk without affecting the whole upload.
    logs_backup: True
    logs_filter_patterns:
     - "(\\w{3}\\s\\d{1,2}\\s\\d{2}:\\d{2}:\\d{2}\\.\\d+).+"         # Sep 9 11:20:36.123425532
     - "kinit (\\d+/\\d+/\\d+\\s\\d{2}:\\d{2}:\\d{2})\\s+"          # kinit 2023/09/15 11:20:36 log
     - "(\\d{4}-\\d{2}-\\d{2}T\\d{2}:\\d{2}:\\d{2}\\.\\d+Z).+"      # 2023-09-15T11:20:36.123425532Z log
    oc_cli_path: /usr/bin/oc                                # optional, if not specified will be search in $PATH
Sample output of telemetry
{
    "telemetry": {
        "scenarios": [
            {
                "start_timestamp": 1745343338,
                "end_timestamp": 1745343683,
                "scenario": "scenarios/network_chaos.yaml",
                "scenario_type": "pod_disruption_scenarios",
                "exit_status": 0,
                "parameters_base64": "",
                "parameters": [
                    {
                        "config": {
                            "execution_type": "parallel",
                            "instance_count": 1,
                            "kubeconfig_path": "/root/.kube/config",
                            "label_selector": "node-role.kubernetes.io/master",
                            "network_params": {
                                "bandwidth": "10mbit",
                                "latency": "500ms",
                                "loss": "50%"
                            },
                            "node_interface_name": null,
                            "test_duration": 300,
                            "wait_duration": 60
                        },
                        "id": "network_chaos"
                    }
                ],
                "affected_pods": {
                    "recovered": [],
                    "unrecovered": [],
                    "error": null
                },
                "affected_nodes": [],
                "cluster_events": []
            }
        ],
        "node_summary_infos": [
            {
                "count": 3,
                "architecture": "amd64",
                "instance_type": "n2-standard-4",
                "nodes_type": "master",
                "kernel_version": "5.14.0-427.60.1.el9_4.x86_64",
                "kubelet_version": "v1.31.6",
                "os_version": "Red Hat Enterprise Linux CoreOS 418.94.202503121207-0"
            },
            {
                "count": 3,
                "architecture": "amd64",
                "instance_type": "n2-standard-4",
                "nodes_type": "worker",
                "kernel_version": "5.14.0-427.60.1.el9_4.x86_64",
                "kubelet_version": "v1.31.6",
                "os_version": "Red Hat Enterprise Linux CoreOS 418.94.202503121207-0"
            }
        ],
        "node_taints": [
            {
                "node_name": "prubenda-g-qdcvv-master-0.c.chaos-438115.internal",
                "effect": "NoSchedule",
                "key": "node-role.kubernetes.io/master",
                "value": null
            },
            {
                "node_name": "prubenda-g-qdcvv-master-1.c.chaos-438115.internal",
                "effect": "NoSchedule",
                "key": "node-role.kubernetes.io/master",
                "value": null
            },
            {
                "node_name": "prubenda-g-qdcvv-master-2.c.chaos-438115.internal",
                "effect": "NoSchedule",
                "key": "node-role.kubernetes.io/master",
                "value": null
            }
        ],
        "kubernetes_objects_count": {
            "ConfigMap": 530,
            "Pod": 294,
            "Deployment": 69,
            "Route": 8,
            "Build": 1
        },
        "network_plugins": [
            "OVNKubernetes"
        ],
        "timestamp": "2025-04-22T17:35:37Z",
        "health_checks": null,
        "total_node_count": 6,
        "cloud_infrastructure": "GCP",
        "cloud_type": "self-managed",
        "cluster_version": "4.18.0-0.nightly-2025-03-13-035622",
        "major_version": "4.18",
        "run_uuid": "96348571-0b06-459e-b654-a1bb6fd66239",
        "job_status": true
    },
    "critical_alerts": null
}