Resiliency Scoring
Beta Feature: Resiliency Scoring is currently in Beta. The API, configuration format, and scoring behavior may change in future releases.
If you encounter any issues or unexpected behavior, please open a bug report at github.com/krkn-chaos/krkn/issues. Include your configuration, krkn version, and any relevant logs or output.
Introduction
What is the Resiliency Score? The Resiliency Score is a percentage (0-100%) that represents the health and stability of your Kubernetes cluster during a chaos scenario. It is calculated by evaluating a set of Service Level Objectives (SLOs) against live Prometheus data.
Why use it?
A simple pass or fail doesn’t tell the whole story. A score of 95% indicates a robust system with minor degradation, while a score of 60% reveals significant issues that need investigation, even if the chaos scenario technically “passed”. This allows you to track resilience improvements over time and make data-driven decisions.
How does it work? After a chaos scenario completes, Krkn evaluates a list of pre-defined SLOs (which are Prometheus alert expressions) over the chaos time window. It counts how many SLOs passed and failed, applies a weighted scoring model, and embeds a detailed report in the final telemetry output.
The Scoring Algorithm
The final score is calculated using a weighted pass/fail model. By default, weights are based on SLO severity, but you can also assign custom weights to individual SLOs for more granular control.
SLO Severity and Default Weights
Each SLO is assigned a severity of either warning or critical:
- Warning: Represents performance degradation or minor issues. Worth 1 point by default.
- Critical: Represents significant service impairment or outages. Worth 3 points by default.
Custom Weights
In addition to severity-based weighting, you can assign a custom weight to any individual SLO. This allows you to fine-tune the scoring model based on your specific requirements. When a custom weight is specified, it overrides the default severity-based weight for that SLO.
Use cases for custom weights:
- Emphasize business-critical SLOs beyond standard severity levels
- De-emphasize less important warnings
- Create custom scoring profiles for different environments or use cases
Formula
The score is calculated as a percentage of the total possible points achieved.
Score % = ((Total Points - Points Lost) / Total Points) * 100
Where:
- Total Points: The sum of weights for all evaluated SLOs (either custom weight or severity-based weight).
- Points Lost: The sum of weights for all failed SLOs.
Example Calculation (Severity-based):
- Profile: 5 critical SLOs, 15 warning SLOs.
- Total Possible Points:
(5 * 3) + (15 * 1) = 30. - Chaos Outcome: 1 critical SLO and 4 warning SLOs failed.
- Points Lost:
(1 * 3) + (4 * 1) = 7. - Final Score:
((30 - 7) / 30) * 100 = 76.6%.
Example Calculation (With Custom Weights):
- Profile: 3 SLOs with custom weights (10, 5, 2), 2 critical SLOs (default weight 3 each).
- Total Possible Points:
10 + 5 + 2 + (2 * 3) = 23. - Chaos Outcome: The SLO with weight 10 failed, and 1 critical SLO failed.
- Points Lost:
10 + 3 = 13. - Final Score:
((23 - 13) / 23) * 100 = 43.5%.
Defining SLOs with Custom Weights
SLOs are defined in the alerts YAML file (typically config/alerts.yaml). The format supports both the traditional severity-only format and an extended format with custom weights.
Traditional Format (Severity Only)
- expr: avg_over_time(histogram_quantile(0.99, rate(etcd_disk_wal_fsync_duration_seconds_bucket[2m]))[10m:]) > 0.01
  description: 10 minutes avg. 99th etcd fsync latency higher than 10ms
  severity: warning

- expr: etcd_server_has_leader{job=~".*etcd.*"} == 0
  description: etcd cluster has no leader
  severity: critical
In this format, the weight is automatically determined by severity: critical = 3 points, warning = 1 point.
Extended Format (With Custom Weight)
- expr: avg_over_time(histogram_quantile(0.99, rate(etcd_disk_wal_fsync_duration_seconds_bucket[2m]))[10m:]) > 0.01
  description: 10 minutes avg. 99th etcd fsync latency higher than 10ms
  severity: warning
  weight: 5

- expr: etcd_server_has_leader{job=~".*etcd.*"} == 0
  description: etcd cluster has no leader
  severity: critical
  weight: 10
In this format, you specify an explicit weight value that overrides the default severity-based weight. The severity field is still required for classification purposes.
Mixed Format Example
You can mix both formats in the same file:
# Business-critical SLO with custom high weight
- expr: up{job="payment-service"} == 0
  description: Payment service is down
  severity: critical
  weight: 15

# Standard critical SLO (uses default weight of 3)
- expr: etcd_server_has_leader{job=~".*etcd.*"} == 0
  description: etcd cluster has no leader
  severity: critical

# Low-priority warning with reduced weight
- expr: node_filesystem_free_bytes{mountpoint="/"} / node_filesystem_size_bytes < 0.1
  description: Root filesystem less than 10% free
  severity: warning
  weight: 0.5

# Standard warning (uses default weight of 1)
- expr: rate(http_requests_total{code="500"}[5m]) > 0.01
  description: High rate of 500 errors
  severity: warning
Configuration
The resiliency scoring system can be configured in your Krkn configuration file (config/config.yaml). If no resiliency section is specified, Krkn will automatically run in standalone mode and use the alerts file defined under performance_monitoring: - alert_profile: <alerts.yaml>.
resiliency:
  resiliency_run_mode: standalone  # Options: standalone, controller, disabled
  resiliency_file: config/alerts.yaml  # Path to SLO definitions
Configuration Options:
resiliency_run_mode: Determines how resiliency scoring operatesstandalone(default): Calculates score and embeds in telemetry outputcontroller: Prints resiliency report to stdout for krknctl integrationdisabled: Disables resiliency scoring
resiliency_file: Path to the YAML file containing SLO definitions. If not specified, defaults to thealert_profilesetting fromperformance_monitoring, orconfig/alerts.yamlif neither is set.
Execution Modes
Krkn supports three execution modes:
Mode 1: Standalone (Default)
Uses config/alerts.yaml or the file specified in configuration.
- Runs the chaos scenario.
- Loads SLO definitions from the alerts file.
- Evaluates each SLO against Prometheus over the chaos time window.
- Calculates the score and writes an overview into
kraken.reportand the full report inresiliency-report.json.
Example telemetry snippet:
{
  "telemetry": {
    "run_uuid": "717c8135-2aa0-47c9-afdf-3a6fe855c535",
    "job_status": false,
    "overall_resiliency_report": {
            "scenarios": {
                "<scenario_1>": 97,
                "<scenario_2>": 97
            },
            "resiliency_score": 97,
            "passed_slos": 26,
            "total_slos": 27
        },
  }
}
Example resiliency-report snippet:
{
  "scenarios": [
    {
      "name": "<scenario_1>",
      "window": {
        "start": "2026-03-18T15:36:14",
        "end": "2026-03-18T15:36:25"
      },
      "score": 97,
      "weight": 1,
      "breakdown": {
        "total_points": 45,
        "points_lost": 1,
        "passed": 26,
        "failed": 1
      },
      "slo_results": {
        "10 minutes avg. 99th etcd fsync latency on {{$labels.pod}} higher than 10ms. {{$value}}s": true,
        ...
      },
      "health_check_results": {}
    },
    {
      "name": "<scenario_2>",
      "window": {
        "start": "2026-03-18T15:36:27",
        "end": "2026-03-18T15:37:19"
      },
      "score": 97,
      "weight": 1,
      "breakdown": {
        "total_points": 45,
        "points_lost": 1,
        "passed": 26,
        "failed": 1
      },
      "slo_results": {
        "10 minutes avg. 99th etcd fsync latency on {{$labels.pod}} higher than 10ms. {{$value}}s": true,
        ...
      },
      "health_check_results": {}
    }
  ]
}
Mode 2: Controller (krknctl integration)
Activated by setting resiliency_run_mode: controller in configuration.
- Krkn runs inside a container launched by krknctl.
- After scoring, it prints a detailed JSON report prefixed with
KRKN_RESILIENCY_REPORT_JSON:. - krknctl captures this output and aggregates scores across multiple scenarios.
Example stdout snippet:
2025-11-10 10:30:05 [INFO] Resiliency check complete. Score: 76.6%
KRKN_RESILIENCY_REPORT_JSON:{"scenarios":[{"name":"node-cpu-hog","score":76,"weight":1.0,"breakdown":{"total_points":30,"points_lost":7,"passed":18,"failed":2}}]}
For multi-scenario runs with per-scenario weighting and parallel execution, use krknctl.
Architecture and Implementation
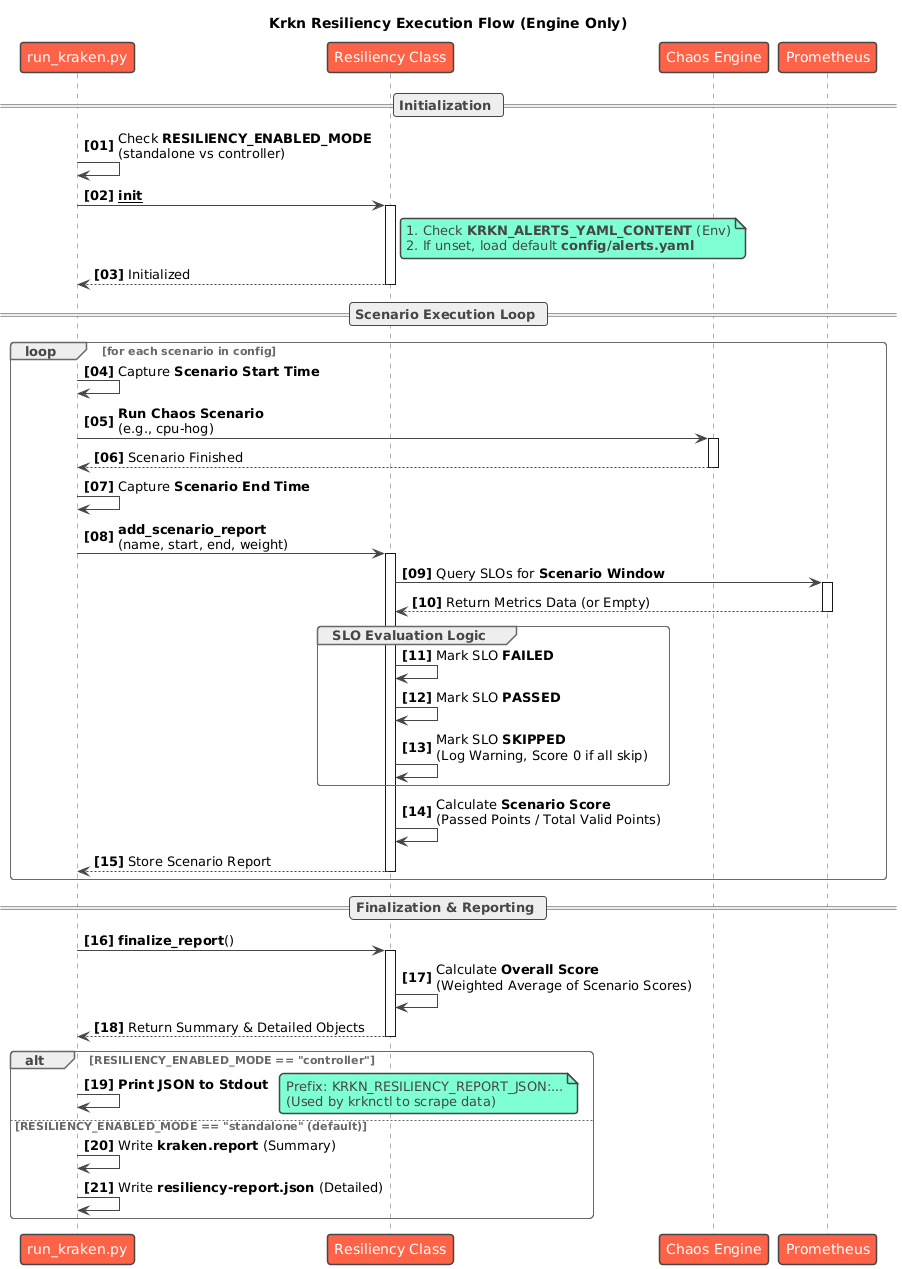
A single Resiliency class in krkn/resiliency/resiliency.py manages the entire lifecycle:
Initialization
- Loads SLO definitions from the alerts YAML file
- Parses both traditional (severity-only) and extended (with custom weights) formats
- Detects the execution mode from configuration
Evaluation
- Iterates through each SLO and executes its Prometheus
exprquery over the chaos time window - Uses the
evaluate_slos()function fromkrkn/prometheus/collector.py
- Iterates through each SLO and executes its Prometheus
Result Mapping
- A non-empty query result marks the SLO as failed
- An empty result marks it as passed
- SLOs that return no data from Prometheus are excluded from scoring
Scoring
- For each SLO, determines the weight: uses custom weight if specified, otherwise uses severity-based weight (critical = 3, warning = 1)
- Calculates total points and points lost
- Derives the percentage score using the formula above
Reporting
- Standalone mode: Embeds the report into telemetry and writes to
kraken.report - Controller mode: Serializes the report to JSON and prints with the
KRKN_RESILIENCY_REPORT_JSON:prefix for krknctl consumption
- Standalone mode: Embeds the report into telemetry and writes to
Scenario-based Resiliency Scoring
For multi-scenario chaos runs, Krkn supports per-scenario resiliency scoring with weighted aggregation:
- Each scenario gets its own resiliency score calculated over its specific time window
- Each scenario can have a weight assigned (default: 1.0)
- The final resiliency score is a weighted average of all scenario scores
Weighted Average Formula:
This allows you to prioritize certain scenarios over others when calculating the overall resiliency score for a chaos run.
Best Practices
Start with Severity-based Weights: Use the default severity-based weights (critical=3, warning=1) as a baseline.
Apply Custom Weights Strategically: Only use custom weights for SLOs that truly warrant special attention:
- Business-critical services that require higher weight than standard critical SLOs
- Low-impact warnings that should have minimal effect on the score
Document Your Weighting Decisions: Add comments in your alerts.yaml to explain why specific custom weights were chosen.
Test Your Scoring Profile: Run chaos scenarios and review the resulting scores to ensure your weighting model reflects your actual priorities.
Version Control Your Alerts: Keep your alerts.yaml in version control and track changes to your SLO definitions and weights over time.
Use Consistent Weight Scales: If using custom weights, maintain a consistent scale (e.g., 1-20) to make weights comparable across SLOs.
Example: Complete Alerts Profile with Custom Weights
# Business-critical: Payment processing must stay available
- expr: up{job="payment-api"} == 0
  description: Payment API is completely down
  severity: critical
  weight: 20

# Business-critical: Core authentication service
- expr: up{job="auth-service"} == 0
  description: Authentication service is down
  severity: critical
  weight: 15

# Standard critical: etcd cluster health (uses default weight of 3)
- expr: etcd_server_has_leader{job=~".*etcd.*"} == 0
  description: etcd cluster has no leader
  severity: critical

# High-priority warning: API latency
- expr: histogram_quantile(0.99, sum(rate(http_request_duration_seconds_bucket[5m])) by (le)) > 1
  description: 99th percentile API latency exceeds 1s
  severity: warning
  weight: 5

# Standard warning: Disk space (uses default weight of 1)
- expr: node_filesystem_avail_bytes{mountpoint="/"} / node_filesystem_size_bytes < 0.2
  description: Root filesystem less than 20% free
  severity: warning

# Low-priority informational warning
- expr: rate(http_requests_total{code=~"4.."}[5m]) > 10
  description: High rate of client errors
  severity: warning
  weight: 0.5
In this example:
- Payment API downtime has the highest weight (20 points)
- Auth service downtime is also critical but slightly less weighted (15 points)
- Standard etcd health uses the default critical weight (3 points)
- API latency warnings are more important than standard warnings (5 points vs 1 point)
- Client error warnings have reduced impact (0.5 points)
This creates a scoring model that heavily emphasizes business-critical services while still accounting for platform stability and performance issues.