This is the multi-page printable view of this section.
Click here to print.
Return to the regular view of this page.
What is krkn-ai?
Krkn-AI lets you automatically run Chaos scenarios and discover the most effective experiments to evaluate your system’s resilience.
How does it work?
Krkn-AI leverages evolutionary algorithms to generate experiments based on Krkn scenarios. By using user-defined objectives such as SLOs and application health checks, it can identify the critical experiments that impact the cluster.
- Generate a Krkn-AI config file using discover. Running this command will generate a YAML file that is pre-populated with cluster component information and basic setup.
- The config file can be further customized to suit your requirements for Krkn-AI testing.
- Start Krkn-AI testing:
- The evolutionary algorithm will use the cluster components specified in the config file as possible inputs required to run the Chaos scenarios.
- User-defined SLOs and application health check feedback are taken into account to guide the algorithm.
- Analyze results, evaluate the impact of different Chaos scenarios on application liveness and their fitness scores.
Getting Started
Follow the installation steps to set up the Krkn-AI CLI.
1 - Getting Started
How to deploy sample microservice and run Krkn-AI test
Getting Started with Krkn-AI
This documentation details how to deploy a sample microservice application on Kubernetes Cluster and run Krkn-AI test.
Prerequisites
- Follow this guide to install Krkn-AI CLI.
- Krkn-AI uses Thanos Querier to fetch SLO metrics by PromQL. You can easily install it by setting up prometheus-operator in your cluster.
Deploy Sample Microservice
For demonstration purpose, we will deploy a sample microservice called robot-shop on the cluster:
# Change to Krkn-AI project directory
cd krkn-ai/

# Namespace where to deploy the microservice application
export DEMO_NAMESPACE=robot-shop

# Whether the K8s cluster is an OpenShift cluster
export IS_OPENSHIFT=true
./scripts/setup-demo-microservice.sh

# Set context to the demo namespace
oc config set-context --current --namespace=$DEMO_NAMESPACE
# If you are using kubectl:
# kubectl config set-context --current --namespace=$DEMO_NAMESPACE

# Check whether pods are running
oc get pods
We will deploy a NGINX reverse proxy and a LoadBalancer service in the cluster to expose the routes for some of the pods.
# Setup NGINX reverse proxy for external access
./scripts/setup-nginx.sh

# Check nginx pod
oc get pods -l app=nginx-proxy

# Test application endpoints
./scripts/test-nginx-routes.sh

export HOST="http://$(kubectl get service rs -o json | jq -r '.status.loadBalancer.ingress[0].hostname')"
Note
If your cluster uses Ingress or custom annotation to expose the services, make sure to follow those steps.
📝 Generate Configuration
Krkn-AI uses YAML configuration files to define experiments. You can generate a sample config file dynamically by running Krkn-AI discover command.
# Discover components in cluster to generate the config
$ uv run krkn_ai discover -k ./tmp/kubeconfig.yaml \
  -n "robot-shop" \
  -pl "service" \
  -nl "kubernetes.io/hostname" \
  -o ./tmp/krkn-ai.yaml \
  --skip-pod-name "nginx-proxy.*"
Discover command generates a yaml file as an output that contains the initial boilerplate for testing. You can modify this file to include custom SLO definitions, cluster components and configure algorithm settings as per your testing use-case.
Running Krkn-AI
Once your test configuration is set, you can start Krkn-AI testing using the run command. This command initializes a random population sample containing Chaos Experiments based on the Krkn-AI configuration, then starts the evolutionary algorithm to run the experiments, gather feedback, and continue evolving existing scenarios until the total number of generations defined in the config is met.
# Configure Prometheus
# (Optional) In OpenShift cluster, the framework will automatically look for thanos querier in openshift-monitoring namespace.
export PROMETHEUS_URL='https://Thanos-Querier-url'
export PROMETHEUS_TOKEN='enter-access-token'

# Start Krkn-AI test
uv run krkn_ai run -vv -c ./krkn-ai.yaml -o ./tmp/results/ -p HOST=$HOST
Understanding the Results
In the ./tmp/results directory, you will find the results from testing. The final results contain information about each scenario, their fitness evaluation scores, reports, and graphs, which you can use to further investigate.
Tip
You can also visualize and explore these results in real-time or post-run using the interactive
Monitoring Dashboard.
.
└── results/
    ├── reports/
    │   ├── best_scenarios.yaml
    │   ├── health_check_report.csv
    │   └── graphs/
    │       ├── best_generation.png
    │       ├── scenario_1.png
    │       ├── scenario_2.png
    │       └── ...
    ├── yaml/
    │   ├── generation_0/
    │   │   ├── scenario_1.yaml
    │   │   ├── scenario_2.yaml
    │   │   └── ...
    │   └── generation_1/
    │       └── ...
    ├── log/
    │   ├── scenario_1.log
    │   ├── scenario_2.log
    │   └── ...
    └── krkn-ai.yaml
Reports Directory:
health_check_report.csv: Summary of application health checks containing details about the scenario, component, failure status and latency.best_scenarios.yaml: YAML file containing information about best scenario identified in each generation.best_generation.png: Visualization of best fitness score found in each generation.scenario_<ids>.png: Visualization of response time line plot for health checks and heatmap for success and failures.
YAML:
scenario_<id>.yaml: YAML file detailing about the Chaos scenario executed which includes the krknctl command, fitness scores, health check metrices, etc. These files are organised under each generation folder.
Log:
scenario_<id>.log: Logs captured from krknctl scenario.
2 - Cluster Discovery
Automatically discover cluster components for Krkn-AI testing.
Krkn-AI uses a genetic algorithm to generate Chaos scenarios. These scenarios require information about the components available in the cluster, which is obtained from the cluster_components YAML field of the Krkn-AI configuration.
CLI Usage
$ uv run krkn_ai discover --help
Usage: krkn_ai discover [OPTIONS]

  Discover components for Krkn-AI tests

Options:
  -k, --kubeconfig TEXT   Path to cluster kubeconfig file.
  -o, --output TEXT       Path to save config file.
  -n, --namespace TEXT    Namespace(s) to discover components in. Supports
                          Regex and comma separated values.
  -pl, --pod-label TEXT   Pod Label Keys(s) to filter. Supports Regex and
                          comma separated values.
  -nl, --node-label TEXT  Node Label Keys(s) to filter. Supports Regex and
                          comma separated values.
  -v, --verbose           Increase verbosity of output.
  --skip-pod-name TEXT    Pod name to skip. Supports comma separated values
                          with regex.
  -S, --save-strategy [skip|overwrite|merge]
                          How to save: skip, overwrite (replace), or merge
                          (add new components, keep your edits). Note: merge
                          does not preserve comments.
  --learned-weights TEXT  Path to a learned_weights.json from a previous run,
                          to prioritize fitness queries.
  --help                  Show this message and exit.
Alongside cluster_components, discover also fills in the scenarios your cluster can run, health check URLs built from LoadBalancer services, and fitness queries validated against your Prometheus.
Example
The example below filters cluster components from namespaces that match the patterns robot-.* and etcd. In addition to namespaces, we also provide filters for pod labels and node labels. This allows us to narrow down the necessary components to consider when running a Krkn-AI test.
uv run krkn_ai discover -k ./tmp/kubeconfig.yaml \
  -n "robot-.*,etcd" \
  -pl "service,env" \
  -nl "disktype" \
  -o ./krkn-ai.yaml
The above command generates a config file that contains the basic setup to help you get started. You can customize the parameters as described in the configs documentation. If you want to exclude any cluster components—such as a pod, node, or namespace—from being considered for Krkn-AI testing, simply remove them from the cluster_components YAML field.
# Path to your kubeconfig file
kubeconfig_file_path: "./path/to/kubeconfig.yaml"

# Duration to wait before running next scenario (seconds)
wait_duration: 30

# Algorithm selector
algorithm: genetic

# Genetic algorithm parameters
genetic:
  generations: 5
  population_size: 10
  composition_rate: 0.3
  population_injection_rate: 0.1
  scenario_mutation_rate: 0.6

# Specify how result filenames are formatted
output:
  result_name_fmt: "scenario_%s.yaml"
  graph_name_fmt: "scenario_%s.png"
  log_name_fmt: "scenario_%s.log"

# Fitness queries recommended from the cluster's Prometheus
fitness_function:
  include_krkn_failure: true
  include_health_check_failure: true
  include_health_check_response_time: true
  items:
  # pod-restarts:robot-shop
  - query: '(sum(increase(kube_pod_container_status_restarts_total{namespace="robot-shop"}[$range$]))) or vector(0)'
    type: range
    weight: 0.5
  # node-pressure
  - query: '(sum(kube_node_status_condition{condition=~"MemoryPressure|DiskPressure|PIDPressure", status="true"})) or vector(0)'
    type: range
    weight: 0.5

# Application endpoints discovered from LoadBalancer services
health_checks:
  stop_watcher_on_failure: false
  stop_timeout: 5
  applications:
  - name: "cart"
    url: "http://192.0.2.10:80/health"

# Chaos scenarios your cluster can run, decided during discovery
scenario:
  pod-scenarios:
    enable: true
  application-outages:
    enable: true
  container-scenarios:
    enable: true
  node-cpu-hog:
    enable: true
  node-memory-hog:
    enable: true
  kubevirt-scenarios:
    enable: false

# Cluster components to consider for Krkn-AI testing
cluster_components:
  namespaces:
  - name: robot-shop
    pods:
    - containers:
      - name: cart
      labels:
        service: cart
        env: dev
      name: cart-7cd6c77dbf-j4gsv
    - containers:
      - name: catalogue
      labels:
        service: catalogue
        env: dev
      name: catalogue-94df6b9b-pjgsr

    services:
    - labels:
        app.kubernetes.io/managed-by: Helm
      name: cart
      ports:
      - port: 8080
        protocol: TCP
        target_port: 8080
    - labels:
        app.kubernetes.io/managed-by: Helm
        service: catalogue
      name: catalogue
      ports:
      - port: 8080
        protocol: TCP
        target_port: 8080

  - name: etcd
    pods:
    - containers:
      - name: etcd
        labels:
          service: etcd
        name: etcd-0
    - containers:
      - name: etcd
        labels:
          service: etcd
        name: etcd-1
  nodes:
  - labels:
      kubernetes.io/hostname: node-1
      disktype: SSD
    name: node-1
    taints: []
  - labels:
      kubernetes.io/hostname: node-2
      disktype: HDD
    name: node-2
    taints: []
Save Strategy
By default discover won’t overwrite an existing output file. Control this with --save-strategy:
| Strategy |
Behavior |
skip (default) |
Keep the existing file, do nothing. |
overwrite |
Replace the file with a fresh config. |
merge |
Keep your edits, add newly discovered components. |
uv run krkn_ai discover -k ./tmp/kubeconfig.yaml -o ./krkn-ai.yaml --save-strategy merge
merge preserves manual edits (e.g. disabled: true) and adds newly discovered components.
Note: Comments inside cluster_components are not preserved after a merge.
The save strategy also decides how much of the config is regenerated. Scenario enablement and health checks are only worked out when the file is written fresh, either because it does not exist yet or because you passed overwrite. Fitness queries are also refreshed on merge.
| Strategy |
Cluster components |
Scenarios and health checks |
Fitness queries |
skip (file exists) |
unchanged |
unchanged |
unchanged |
overwrite |
replaced |
regenerated |
regenerated |
merge |
added to |
unchanged |
new ones added |
3 - Run Krkn-AI
Execute automated resilience and chaos testing using the Krkn-AI run command.
The run command executes automated resilience and chaos testing using Krkn-AI. It initializes a random population samples containing Chaos Experiments based on your Krkn-AI configuration file, then starts the evolutionary algorithm to run the experiments, gather feedback, and continue evolving existing scenarios until stopping criteria is met.
CLI Usage
$ uv run krkn_ai run --help
Usage: krkn_ai run [OPTIONS]

  Run Krkn-AI tests

Options:
  -k, --kubeconfig TEXT                 Path to cluster kubeconfig file. Overrides value in config file.
  -c, --config TEXT                     Path to Krkn-AI config file.
  -o, --output TEXT                     Directory to save results.
  -f, --format [json|yaml]              Format of the output file.  [default: yaml]
  -r, --runner-type [krknctl|krknhub]   Type of chaos engine to use.
  -p, --param TEXT                      Additional parameters for config file in key=value format.
  -s, --seed INTEGER                    Random seed for reproducible runs. Overrides seed in config file.
  -v, --verbose                         Increase verbosity of output.  [default: 0]
  -m, --monitoring                      Launch live monitoring dashboard in the background.
  --port INTEGER                        Port to run Streamlit server on when monitoring is enabled.  [default: 8501]
  --help                                Show this message and exit.
Example
The following command runs Krkn-AI with verbose output (-vv), specifies the configuration file (-c), sets the output directory for results (-o), and passes an additional parameter (-p) to override the HOST variable in the config file:
$ uv run krkn_ai run -vv -c ./krkn-ai.yaml -o ./tmp/results/ -p HOST=$HOST
By default, Krkn-AI uses krknctl as engine. You can switch to krknhub by using the following flag:
$ uv run krkn_ai run -r krknhub -c ./krkn-ai.yaml -o ./tmp/results/
Output Structure
Each run creates a UUID-named subdirectory under the path passed to -o, so multiple runs don’t overwrite each other.
tmp/results/
└── <run-uuid>/
    ├── krkn-ai.yaml         # config snapshot (useful for re-running)
    ├── reports/
    │   ├── health_check_report.csv  # app health across scenarios
    │   ├── all.csv                  # metrics for every scenario
    │   ├── best_scenarios.yaml      # top scenarios found by the algorithm
    │   └── graphs/                  # per-scenario PNG plots
    ├── yaml/
    │   ├── generation_0/    # scenario files for gen 0
    │   ├── generation_1/    # scenario files for gen 1
    │   └── ...
    └── log/                 # per-scenario logs
4 - Run Krkn-AI (Container)
Use Krkn-AI with a container image.
Krkn-AI can be run inside containers, which simplifies integration with continuous testing workflows.
Container Image
A pre-built container image is available on Quay.io:
podman pull quay.io/krkn-chaos/krkn-ai:latest
Running the Container
The container supports two modes controlled by the MODE environment variable:
1. Discovery Mode
Discovers cluster components and generates a configuration file.
Usage:
# create a folder
mkdir -p ./tmp/container/

# copy kubeconfig to ./tmp/container

# execute discover command
podman run --rm \
  --net="host" \
  -v ./tmp/container:/mount:Z \
  -e MODE="discover" \
  -e KUBECONFIG="/mount/kubeconfig.yaml" \
  -e OUTPUT_DIR="/mount" \
  -e NAMESPACE="robot-shop" \
  -e POD_LABEL="service" \
  -e NODE_LABEL="kubernetes.io/hostname" \
  -e SKIP_POD_NAME="nginx-proxy.*" \
  -e VERBOSE="2" \
  quay.io/krkn-chaos/krkn-ai:latest
Environment Variables (Discovery):
MODE=discover (required)KUBECONFIG (required) - Path to kubeconfig file (default: /input/kubeconfig)OUTPUT_DIR (optional) - Output directory (default: /output)NAMESPACE (optional) - Namespace pattern (default: .*)POD_LABEL (optional) - Pod label pattern (default: .*)NODE_LABEL (optional) - Node label pattern (default: .*)SKIP_POD_NAME (optional) - Pod names to skip (comma-separated regex)VERBOSE (optional) - Verbosity level 0-2 (default: 0)
2. Run Mode
Executes Krkn-AI tests based on a configuration file.
Note
The container image only supports the krknhub runner type. The krknctl runner is not supported due to limitations around mounting the Podman socket inside a container.
Usage:
podman run --rm \
  --net="host" \
  --privileged \
  -v ./tmp/container:/mount:Z \
  -e MODE=run \
  -e CONFIG_FILE="/mount/krkn-ai.yaml" \
  -e KUBECONFIG="/mount/kubeconfig.yaml" \
  -e OUTPUT_DIR="/mount/result/" \
  -e EXTRA_PARAMS="HOST=${HOST}" \
  -e VERBOSE=2 \
  quay.io/krkn-chaos/krkn-ai:latest
Environment Variables (Run):
MODE=run (required)KUBECONFIG (required) - Path to kubeconfig file (default: /input/kubeconfig)CONFIG_FILE (required) - Path to krkn-ai config file (default: /input/krkn-ai.yaml)OUTPUT_DIR (optional) - Output directory (default: /output)FORMAT (optional) - Output format: json or yaml (default: yaml)EXTRA_PARAMS (optional) - Additional parameters in key=value format (comma-separated)VERBOSE (optional) - Verbosity level 0-2 (default: 0)
Podman Considerations
Run without --privileged flag
If you do not want to use the --privileged flag due to security concerns, you can leverage the host’s fuse-overlayfs to run a Podman container.
mkdir -p ./tmp/container/result && chmod 777 ./tmp/container/result

podman run --rm \
  --net="host" \
  --user podman \
  --device=/dev/fuse --security-opt label=disable \
  -v ./tmp/container:/mount:Z \
  -e MODE=run \
  -e CONFIG_FILE="/mount/krkn-ai.yaml" \
  -e KUBECONFIG="/mount/kubeconfig.yaml" \
  -e OUTPUT_DIR="/mount/result/" \
  -e EXTRA_PARAMS="HOST=${HOST}" \
  -e VERBOSE=2 \
  quay.io/krkn-chaos/krkn-ai:latest
Cache KrknHub images
When running Krkn-AI as a Podman container inside another container with FUSE, you can mount a volume to the container’s shared storage location to enable downloading and caching of KrknHub images.
podman volume create mystorage

mkdir -p ./tmp/container/result && chmod 777 ./tmp/container/result

podman run --rm \
  --net="host" \
  --user podman \
  --device=/dev/fuse --security-opt label=disable \
  -v ./tmp/container:/mount:Z \
  -v mystorage:/home/podman/.local/share/containers:rw \
  -e MODE=run \
  -e CONFIG_FILE="/mount/krkn-ai.yaml" \
  -e KUBECONFIG="/mount/kubeconfig.yaml" \
  -e OUTPUT_DIR="/mount/result/" \
  -e EXTRA_PARAMS="HOST=${HOST}" \
  -e VERBOSE=2 \
  quay.io/krkn-chaos/krkn-ai:latest
5 - Configuration
Configuring Krkn-AI
Krkn-AI is configured using a simple declarative YAML file. This file can be automatically generated using Krkn-AI’s discover feature, which creates a config file from a boilerplate template. The generated config file will have the cluster components pre-populated based on your cluster.
Config Structure
The config file has two layers: top-level settings that apply regardless of the optimization algorithm, and algorithm-specific sections scoped under their own key. The algorithm field selects which engine to use (currently only genetic), and all parameters for that engine live under the corresponding section:
kubeconfig_file_path: "./tmp/kubeconfig.yaml"
wait_duration: 120

algorithm: genetic          # algorithm selector

genetic:                    # all genetic algorithm parameters live here
  generations: 20
  population_size: 10
  # ...

fitness_function:
  query: 'sum(kube_pod_container_status_restarts_total)'
  type: point

scenario:
  pod-scenarios:
    enable: true

cluster_components:
  namespaces: [...]
  nodes: [...]
Backward compatibility: Config files using the old flat layout (GA fields at root level) are still supported — they are automatically migrated on load.
See the subsections below for detailed documentation of each config block.
5.1 - Evolutionary Algorithm
Configuring Evolutionary Algorithm
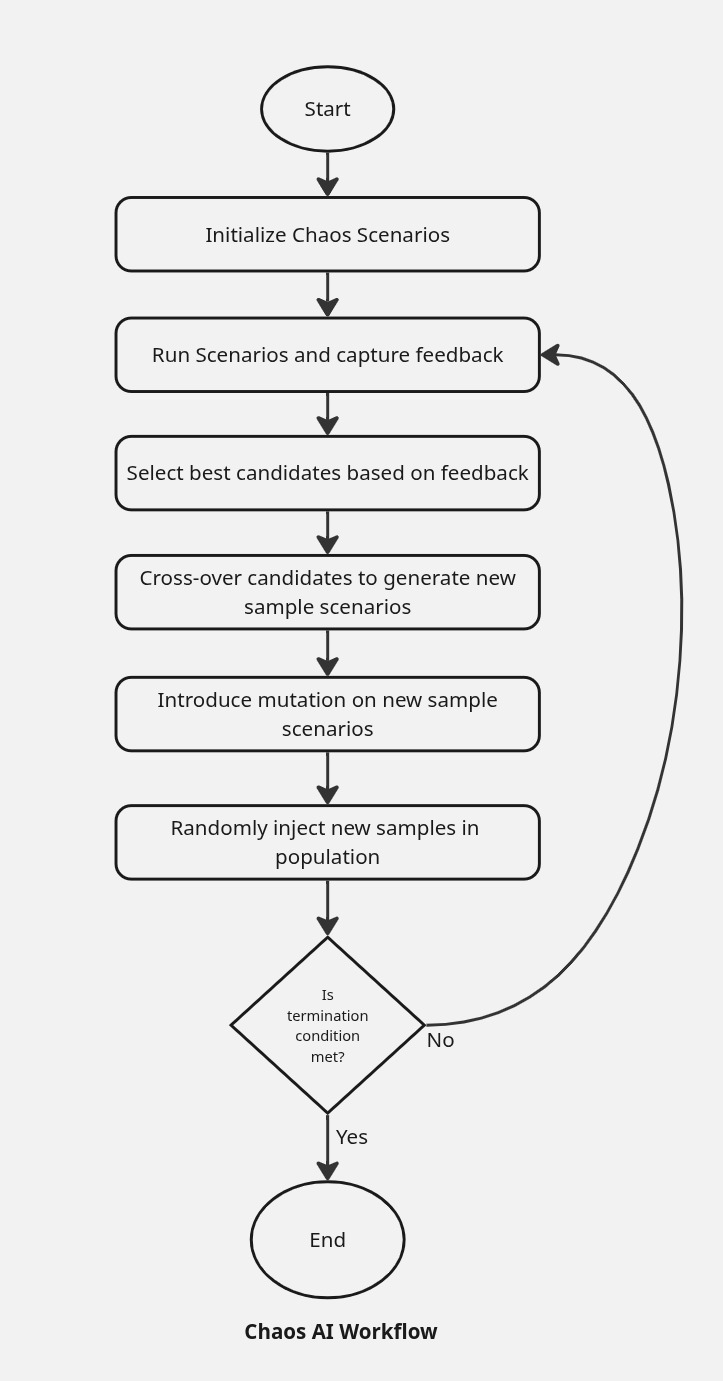
Krkn-AI uses an online learning approach by leveraging an evolutionary algorithm, where an agent runs tests on the actual cluster and gathers feedback by measuring various KPIs for your cluster and application. The algorithm begins by creating random population samples that contain Chaos scenarios. These scenarios are executed on the cluster, feedback is collected, and then the best samples (parents) are selected to undergo crossover and mutation operations to generate the next set of samples (offspring). The algorithm relies on heuristics to guide the exploration and exploitation of scenarios.
Terminologies
- Generation: A single iteration or cycle of the algorithm during which the population evolves. Each generation produces a new set of candidate solutions.
- Population: The complete set of candidate solutions (individuals) at a given generation.
- Sample (or Individual): A single candidate solution within the population, often represented as a chromosome or genome. In our case, this is equivalent to a Chaos experiment.
- Selection: The process of choosing individuals from the population (based on fitness) to serve as parents for producing the next generation.
- Crossover: The operation of combining two Chaos experiments to produce a new scenario, encouraging the exploration of new solutions.
- Mutation: A random alteration of parts of a Chaos experiment.
- Scenario Mutation: The scenario itself is changed to a different one, introducing greater diversity in scenario execution while retaining the existing run properties.
- Composition: The process of combining existing Chaos experiments into a grouped scenario to represent a single new scenario.
- Population Injection: The introduction of new individuals into the population to escape stagnation.
Algorithm Selector
algorithm
Selects which optimization engine to use. (Default: genetic)
Currently the only supported value is genetic. The architecture is designed to support future engines — each engine gets its own config section.
Configurations
The algorithm relies on specific configurations to guide its execution. These settings live under the genetic: section of the Krkn-AI config file, which you generate using the discover command.
Backward compatibility: Config files using the old flat layout (GA fields at root level) are still supported — they are automatically migrated on load.
algorithm: genetic

genetic:
  generations: 20
  population_size: 10
  mutation_rate: 0.7
  scenario_mutation_rate: 0.6
  crossover_rate: 0.6
  composition_rate: 0.0
  selection_strategy: "roulette"
  # tournament_size: 3
  population_injection_rate: 0.0
  population_injection_size: 2
  adaptive_mutation:
    enable: false
  # stopping_criteria:
  #   fitness_threshold: 200
genetic.generations
Total number of generation loops to run. (Default: 20)
- The value for this field should be at least 1.
- Setting this to a higher value increases Krkn-AI testing coverage.
- Each scenario tested in the current generation retains some properties from the previous generation.
- Mutually exclusive with
duration — set one or the other.
genetic.duration
Maximum time (in seconds) the algorithm should run. (Default: disabled)
- When set, the algorithm runs until the duration elapses instead of counting generations.
- Mutually exclusive with
generations — set one or the other.
genetic.population_size
Minimum population size in each generation. (Default: 10)
- The value for this field should be at least 2.
- Setting this to a higher value will increase the number of scenarios tested per generation, which is helpful for running diverse test samples.
- A higher value is also preferred when you have a large set of objects in cluster components and multiple scenarios enabled.
- If you have a limited set of components to be evaluated, you can set a smaller population size and fewer generations.
genetic.crossover_rate
How often crossover should occur for each scenario parameter. (Default: 0.6; Range: [0.0, 1.0])
- A higher crossover rate increases the likelihood that a crossover operation will create two new candidate solutions from two existing candidates.
- Setting the crossover rate to
1.0 ensures that crossover always occurs during selection process.
genetic.mutation_rate
How often mutation should occur for each scenario parameter. (Default: 0.7; Range: [0.0, 1.0])
- This helps to control the diversification among the candidates. A higher value increases the likelihood that a mutation operation will be applied.
- Setting this to
1.0 ensures persistent mutation during the selection process.
genetic.scenario_mutation_rate
How often a mutation should result in a change to the scenario. (Default: 0.6; Range: [0.0, 1.0])
- A higher rate increases diversity between scenarios in each generation.
- A lower rate gives priority to retaining the existing scenario across generations.
genetic.composition_rate
How often a crossover would lead to composition. (Default: 0.0; Range: [0.0, 1.0])
- By default, this value is disabled, but you can set it to a higher rate to increase the likelihood of composition.
genetic.selection_strategy
Strategy used to select parents for the next generation. (Default: roulette)
roulette — Fitness-proportionate selection. Higher-fitness individuals have a greater probability of being selected.tournament — Randomly selects a subset of individuals and picks the best. Use tournament_size to control the subset size.
genetic.tournament_size
Number of individuals competing in each tournament round when selection_strategy is set to tournament. (Default: 3)
genetic.population_injection_rate
How often random samples get newly added to the population. (Default: 0.0; Range: [0.0, 1.0])
- A higher injection rate increases the likelihood of introducing new candidates into the existing generation.
genetic.population_injection_size
Size of random samples that get added to the new population. (Default: 2)
- A higher injection size means that more diversified samples get added during the evolutionary algorithm loop.
- This is beneficial if you want to start with a smaller population test set and then increase the population size as you progress through the test.
genetic.adaptive_mutation
Dynamically adjusts the mutation rate based on fitness convergence. When enabled, the mutation rate automatically increases when the population stagnates and decreases when progress is being made.
genetic:
  adaptive_mutation:
    enable: false       # Enable adaptive mutation (Default: false)
    min: 0.05           # Minimum mutation rate (Default: 0.05)
    max: 0.9            # Maximum mutation rate (Default: 0.9)
    threshold: 0.1      # Fitness improvement threshold to detect stagnation (Default: 0.1)
    generations: 5      # Number of generations to look back for stagnation (Default: 5)
genetic.stopping_criteria
Configuration for advanced stopping conditions based on fitness, saturation, or exploration limits. See Stopping Criteria for full details.
Top-Level Settings
The following fields remain at the top level of the config file (outside the genetic: section):
wait_duration
Time to wait after scenario execution. Sets Krkn’s --wait-duration parameter. (Default: 120 seconds)
5.2 - Fitness Function
Configuring Fitness Function
The fitness function is a crucial element in the Krkn-AI algorithm. It evaluates each Chaos experiment and generates a score. These scores are then used during the selection phase of the algorithm to identify the best candidate solutions in each generation.
- The fitness function can be defined as an SLO or as cluster metrics using a Prometheus query.
- Fitness scores are calculated for the time range during which the Chaos scenario is executed.
Example
Let’s look at a simple fitness function that calculates the total number of restarts in a namespace:
fitness_function:
  query: 'sum(kube_pod_container_status_restarts_total{namespace="robot-shop"})'
  type: point
This fitness function calculates the number of restarts that occurred during the test in the specified namespace. The resulting value is referred to as the Fitness Function Score. These scores are computed for each scenario in every generation and can be found in the scenario YAML configuration within the results. Below is an example of a scenario YAML configuration:
generation_id: 0
scenario_id: 1
scenario:
  name: node-memory-hog(60, 89, 8, kubernetes.io/hostname=node1,
    [], 1, quay.io/krkn-chaos/krkn-hog)
cmd: 'krknctl run node-memory-hog --telemetry-prometheus-backup False --wait-duration
  0 --kubeconfig ./tmp/kubeconfig.yaml --chaos-duration "60" --memory-consumption
  "89%" --memory-workers "8" --node-selector "kubernetes.io/hostname=node1"
  --taints "[]" --number-of-nodes "1" --image "quay.io/krkn-chaos/krkn-hog" '
log: ./results/logs/scenario_1.log
returncode: 0
start_time: '2025-09-01T16:55:12.607656'
end_time: '2025-09-01T16:58:35.204787'
fitness_result:
  scores: []
  fitness_score: 2
job_id: 1
health_check_results: {}
In the above result, the fitness score of 2 indicates that two restarts were observed in the namespace while running the node-memory-hog scenario. The algorithm uses this score as feedback to prioritize this scenario for further testing.
Types of Fitness Function
There are two types of fitness functions available in Krkn-AI: point and range.
Point-Based Fitness Function
In the point-based fitness function type, we calculate the difference in the fitness function value between the end and the beginning of the Chaos experiment. This difference signifies the change that occurred during the experiment phase, allowing us to capture the delta. This approach is especially useful for Prometheus metrics that are counters and only increase, as the difference helps us determine the actual change during the experiment.
E.g SLO: Pod Restarts across “robot-shop” namespace.
fitness_function:
  query: 'sum(kube_pod_container_status_restarts_total{namespace="robot-shop"})'
  type: point
Range-Based Fitness Function
Certain SLOs require us to consider changes that occur over a period of time by using aggregate values such as min, max, or average. For these types of value-based metrics in Prometheus, the range type of Fitness Function is useful.
Because the range type is calculated over a time interval—and the exact timing of each Chaos experiment may not be known in advance—we provide a $range$ parameter that must be used in the fitness function definition.
E.g SLO: Max CPU observed for a container.
fitness_function:
  query: 'max_over_time(container_cpu_usage_seconds_total{namespace="robot-shop", container="mysql"}[$range$])'
  type: range
Defining Multiple Fitness Functions
Krkn-AI allows you to define multiple fitness function items in the YAML configuration, enabling you to track how individual fitness values vary for different scenarios in the final outcome.
You can assign a weight to each fitness function to specify how its value impacts the final score used during Genetic Algorithm selection. Each weight should be between 0 and 1. By default, if no weight is specified, it will be considered as 1.
fitness_function:
  items:
  - query: 'sum(kube_pod_container_status_restarts_total{namespace="robot-shop"})'
    type: point
    weight: 0.3
  - query: 'sum(kube_pod_container_status_restarts_total{namespace="etcd"})'
    type: point
Note: query and items are alternatives. If both are set, query is used and items is ignored.
Krkn Failures
Krkn-AI uses krknctl under the hood to trigger Chaos testing experiments on the cluster. As part of the CLI, it captures various feedback and returns a non-zero status code (exit status 2) when a failure occurs. By default, feedback from these failures is included in the Krkn-AI Fitness Score calculation.
You can disable this by setting the include_krkn_failure to false.
fitness_function:
    include_krkn_failure: false
    query: 'sum(kube_pod_container_status_restarts_total{namespace="robot-shop"})'
    type: point
Note: If a Krkn scenario exits with a non-zero status code other than 2, Krkn-AI assigns a fitness score of -1 and stops the calculation of health scores. This typically indicates a misconfiguration or another issue with the scenario. For more details, please refer to the Krkn logs for the scenario.
Health Check
Results from application health checks are also incorporated into the fitness score, controlled by include_health_check_failure and include_health_check_response_time. Both default to true. You can learn more about health checks and how to configure them in more detail here.
Automatic Recommendations
Writing valid PromQL for an unfamiliar cluster is usually the slowest part of a first run, so discover proposes fitness queries that are already verified against your cluster’s Prometheus.
Krkn-AI ships a catalog of queries covering common failure signals, in catalog.yaml. Each entry is a PromQL template plus the metrics it depends on.
| Category |
Example queries |
availability |
pod-restarts, crashloop-pods, deployment-replicas-missing |
resource |
oom-kills, cpu-throttle |
node |
node-pressure, node-not-ready |
control_plane |
apiserver-errors, apiserver-latency |
etcd |
etcd-request-latency, etcd-leader-changes |
storage |
pvc-pending |
For every entry, Krkn-AI checks:
- Are the metrics available? Every metric the query needs must be scraped by your Prometheus, otherwise the query is rejected.
- Which namespaces? Namespace scoped queries are generated once per discovered namespace, named
<key>:<namespace>, for example pod-restarts:robot-shop.
- Does it return a single value? The query is run against Prometheus and must return one series, since a fitness function has to produce one number.
- How much should it count? Accepted queries are given weights that add up to 1.
Accepted queries are written under items. Rejected ones are commented out with the reason, so you can see what your cluster is missing.
fitness_function:
  include_krkn_failure: true
  include_health_check_failure: true
  include_health_check_response_time: true
  # Fitness queries validated against the cluster's Prometheus.
  items:
  # pod-restarts:robot-shop
  - query: '(sum(increase(kube_pod_container_status_restarts_total{namespace="robot-shop"}[$range$]))) or vector(0)'
    type: range
    weight: 0.5
  # node-pressure
  - query: '(sum(kube_node_status_condition{condition=~"MemoryPressure|DiskPressure|PIDPressure", status="true"})) or vector(0)'
    type: range
    weight: 0.5
  # cpu-throttle:robot-shop (metric(s) not scraped: container_cpu_cfs_throttled_periods_total)
  # - query: '...'
  #   type: range
Every query is wrapped in or vector(0). A Prometheus query that matches nothing returns an empty result, which would fail the scenario; the wrapper turns “nothing happened” into a score of 0.
Prometheus Access
Krkn-AI needs to reach Prometheus during discover to validate the queries.
On OpenShift, the URL is discovered from the Thanos Query route and the token from your kubeconfig credentials. If token discovery comes back empty, as it does for exec or certificate-based auth, set PROMETHEUS_TOKEN explicitly. On other clusters, set the URL yourself:
export PROMETHEUS_URL="http://localhost:9090"
export PROMETHEUS_TOKEN="<token>"
If Prometheus cannot be reached, discover still succeeds and writes a single default query that you can replace later.
Learned Weights
Not every fitness query is equally useful. A query whose value is the same for every scenario tells the algorithm nothing.
After a run, Krkn-AI writes learned_weights.json into the run’s output directory, scoring each query by how much its value varied across scenarios. Feed that back into the next discover to bias the weights towards the queries that actually distinguish scenarios:
uv run krkn_ai discover -k ./tmp/kubeconfig.yaml -o ./krkn-ai.yaml \
  --learned-weights ./results/<run-uuid>/learned_weights.json
Weights are matched per query and namespace, so they only apply when you discover the same namespaces again. They are used as a starting point and are still normalized to add up to 1.
Adding a Query to the Catalog
To contribute a query, add an entry to catalog.yaml:
- key: my-metric
  category: availability
  name: Human readable name
  query_template: 'sum(increase(my_metric_total{namespace="$ns"}[$range$]))'
  requires: [my_metric_total]
  scope: namespace
key and query_template are the only required fields.$ns is replaced with each discovered namespace and $range$ with the scenario duration. Use scope: cluster for queries that are not namespace specific.- The query must aggregate to a single series, so wrap it in
sum(), max() or avg().
- List every metric the query reads in
requires, so Krkn-AI can skip it on clusters that do not scrape them.
- Do not add
or vector(0) yourself, Krkn-AI adds it.
Run discover against a cluster that has the metric and check that your entry comes back enabled.
How to Define a Good Fitness Function
-
Scoring: The higher the fitness score, the more priority will be given to that scenario for generating new sets of scenarios. This also means that scenarios with higher fitness scores are more likely to have an impact on the cluster and should be further investigated.
-
Normalization: Krkn-AI currently does not apply any normalization, except when a fitness function is assigned with weights. While this does not significantly impact the algorithm, from a user interpretation standpoint, it is beneficial to use normalized SLO queries in PromQL. For example, instead of using the maximum CPU for a pod as a fitness function, it may be more convenient to use the CPU percentage of a pod.
-
Use-Case Driven: The fitness function query should be defined based on your use case. If you want to optimize your cluster for maximum uptime, a good fitness function could be to capture restart counts or the number of unavailable pods. Similarly, if you are interested in optimizing your cluster to ensure no downtime due to resource constraints, a good fitness function would be to measure the maximum CPU or memory percentage.
5.3 - Stopping Criteria
Configuring Stopping Criteria for the Genetic Algorithm
The stopping criteria framework lets users define when the genetic algorithm should terminate, allowing for more flexible control beyond strictly generation count or time limits. By configuring these parameters, you can ensure the algorithm stops once it achieves a target fitness or if it reaches a state of saturation where no further improvements or discoveries are being made.
Configurations
You can configure the following options under the genetic.stopping_criteria section of the Krkn-AI config file. All fields are optional and, with the exception of saturation_threshold, default to disabled (null).
fitness_threshold
- Description: Stops the algorithm when the best fitness score reaches or exceeds this specific value.
- Default: Disabled (
null)
This is useful when you have a specific target fitness score (e.g., an SLO violation count) that, once reached, indicates the objective has been met.
generation_saturation
- Description: Stops the algorithm if there is no significant improvement in the best fitness score for N consecutive generations.
- Default: Disabled (
null)
This helps prevent the algorithm from running needlessly after it has converged to a solution.
exploration_saturation
- Description: Stops the algorithm if no new unique scenarios (test cases) are discovered for N consecutive generations.
- Default: Disabled (
null)
This indicates that the algorithm has likely exhausted its search space given the current configuration and is engaging in redundant exploration.
saturation_threshold
- Description: Configures the minimum fitness improvement required to consider a fitness change as “significant” for the purpose of resetting the saturation counter.
- Default:
0.0001
If the improvement in fitness is less than this threshold, it is treated as stagnation.
Example Configuration
genetic:
  stopping_criteria:
    fitness_threshold: 200        # stop when fitness >= 200
    generation_saturation: 5      # stop if no improvement for 5 generations
    exploration_saturation: 3     # stop if no new scenarios for 3 generations
    saturation_threshold: 0.0001  # minimum improvement to reset saturation counter
5.4 - Application Health Checks
Configuring Application Health Checks
When defining the Chaos Config, you can provide details about your application endpoints. Krkn-AI can access these endpoints during the Chaos experiment to evaluate how the application’s uptime is impacted.
Note
Application endpoints must be accessible from the system where Krkn-AI is running in order to reach the service.
Configuration
The health_checks block accepts:
- stop_watcher_on_failure: This setting allows you to stop the health check watcher for an endpoint after it encounters a failure.
- stop_timeout: How long to wait for the health check watcher to shut down at the end of a scenario.
- applications: The list of endpoints to check.
Each application accepts:
- name: Name of the service.
- url: Service endpoint; supports parameterization with “$”.
- status_code: Expected status code returned when accessing the service.
- timeout: Timeout period after which the request is canceled.
- interval: How often to check the endpoint.
Example
health_checks:
  stop_watcher_on_failure: false
  applications:
  - name: cart
    url: "$HOST/cart/add/1/Watson/1"
    status_code: 200
    timeout: 10
    interval: 2
  - name: catalogue
    url: "$HOST/catalogue/categories"
  - name: shipping
    url: "$HOST/shipping/codes"
  - name: payment
    url: "$HOST/payment/health"
  - name: user
    url: "$HOST/user/uniqueid"
  - name: ratings
    url: "$HOST/ratings/api/fetch/Watson"
URL Parameterization
When defining Krkn-AI config files, the URL entry for an application may vary depending on the cluster. To make the URL configuration more manageable, you can specify the values for these parameters at runtime using the --param flag.
In the previous example, the $HOST variable in the config can be dynamically replaced during the Krkn-AI experiment run, as shown below.
uv run krkn_ai run -c krkn-ai.yaml -o results/ -p HOST=http://example.cluster.url/nginx
Automatic Discovery
Rather than writing these URLs by hand, discover can build them from the services it finds in the cluster.
Krkn-AI only considers LoadBalancer services in the discovered namespaces. Ingress, OpenShift Routes, NodePort and ClusterIP services are not used, because they do not give Krkn-AI an address it can reach directly.
For each service, the URL is built as scheme://host:port/path:
- host comes from the load balancer’s external address. Services whose load balancer is still pending are skipped.
- port, path and scheme come from the
httpGet readiness probe on the pod behind the service. If there is no readiness probe, the liveness probe is used instead.
- Probes of type
exec or tcpSocket are ignored, since they carry no URL.
- If no usable probe is found, the URL falls back to the service’s first port at
/.
Krkn-AI then sends a GET request to each URL and treats any response below HTTP 500 as reachable. This check runs from the machine where you run discover, not from inside the cluster, so an endpoint that only resolves within the cluster network is reported as unreachable.
Only endpoints that have a probe and responded are written as active entries. The rest are commented out with the reason, so you can enable them once the cause is fixed.
| Probe found |
Reachable |
Result |
| Yes |
Yes |
Active entry |
| Yes |
No |
Commented, # (unreachable) |
| No |
Any |
Commented, # (no probe) |
health_checks:
  stop_watcher_on_failure: false
  stop_timeout: 5
  applications:
  - name: "cart"
    url: "http://192.0.2.10:80/health"
  # (no probe)
  # - name: "web"
  #   url: "http://192.0.2.11:8080/"
  # (unreachable)
  # - name: "payment"
  #   url: "https://192.0.2.12:443/ready"
If services were found but none qualified, the whole health_checks block is commented out, listing those services with the reason each was rejected. If no LoadBalancer service was found at all, a commented $HOST based example is left in its place as a starting point.
Discovery only runs when the config is written fresh, either because the file does not exist yet or because you passed --save-strategy overwrite.
Making Your Application Discoverable
To have your application picked up automatically:
- Expose it with a service of
type: LoadBalancer.
- Give the container an
httpGet readiness probe pointing at a real health endpoint.
- Make sure the load balancer address is reachable from wherever you run
discover.
readinessProbe:
  httpGet:
    path: /healthz
    port: 8080
The nginx demo in the Krkn-AI repository is set up this way and can be used as a reference.
By default, the results of health checks—including whether each check succeeded and the response times—are incorporated into the overall Fitness Function score. This allows Krkn-AI to use application health as part of its evaluation criteria.
If you want to exclude health check results from influencing the fitness score, you can set the include_health_check_failure and include_health_check_response_time fields to false in your configuration.
fitness_function:
    ...
    include_health_check_failure: false
    include_health_check_response_time: false
5.5 - Scenarios
Available Krkn-AI Scenarios
The following Krkn scenarios are currently supported by Krkn-AI.
At least one scenario must be enabled for the Krkn-AI experiment to run.
When you generate a config with discover, Krkn-AI enables the scenarios your cluster can run and disables the rest. Each scenario needs certain components to be present:
| Scenario |
Requires |
| Pod Scenario |
A running pod with at least one label |
| Application Outages |
A running pod with at least one label |
| Container Scenario |
A running pod with at least one label |
| Node CPU Hog |
A schedulable, ready node |
| Node Memory Hog |
A schedulable, ready node |
| Node IO Hog |
A schedulable, ready node |
| Time Scenario |
A namespace containing pods, and labels on pods or nodes |
| Network Scenarios |
A node with a discovered network interface |
| DNS Outage |
A running pod |
| Syn Flood |
A service that exposes ports |
| PVC Scenario |
A PVC, or a pod in a discovered namespace |
| KubeVirt VM Outage |
A KubeVirt virtual machine instance |
| Storage Throttle |
A PVC, or a pod in a discovered namespace |
If nothing can be built, every scenario is disabled and Krkn-AI logs a warning. That usually means the filters were too narrow, so widen -n and run discover again.
You can always override this. Depending on your use case, enable or disable these scenarios in the krkn-ai.yaml config file by setting the enable field to true or false.
scenario:
  pod-scenarios:
    enable: true

  application-outages:
    enable: false

  container-scenarios:
    enable: false

  node-cpu-hog:
    enable: true

  node-memory-hog:
    enable: true

  node-io-hog:
    enable: false

  syn-flood:
    enable: false

  time-scenarios:
    enable: true

  network-scenarios:
    enable: false

  dns-outage:
    enable: true

  pvc-scenarios:
    enable: false

  kubevirt-scenarios:
    enable: false

  storage-throttle:
    enable: false
5.6 - Output
Configuring output formatters
Krkn-AI generates various output files during the execution of chaos experiments, including scenario YAML files, graph visualizations, and log files. By default, these files follow a standard naming convention, but you can customize the file names using format strings in the configuration file.
Available Parameters
The output section in your krkn-ai.yaml configuration file allows you to customize the naming format for different output file types:
result_name_fmt
Specifies the naming format for scenario result YAML files. These files contain the complete scenario configuration and execution results for each generated scenario.
Default: "scenario_%s.yaml"
graph_name_fmt
Specifies the naming format for graph visualization files. These files contain visual representations of the health check latency and success information.
Default: "scenario_%s.png"
log_name_fmt
Specifies the naming format for log files. These files contain execution logs for each scenario run.
Default: "scenario_%s.log"
The format strings support the following placeholders:
%g - Generation number%s - Scenario ID%c - Scenario Name (e.g pod_scenarios)
Example
Here’s an example configuration that customizes all output file names:
output:
  result_name_fmt: "gen_%g_scenario_%s_%c.yaml"
  graph_name_fmt: "gen_%g_scenario_%s_%c.png"
  log_name_fmt: "gen_%g_scenario_%s_%c.log"
With this configuration, files will be named like:
gen_0_scenario_1_pod_scenarios.yamlgen_0_scenario_1_pod_scenarios.pnggen_0_scenario_1_pod_scenarios.log
5.7 - Elastic Search
Configuring Elasticsearch for Krkn-AI results storage
Krkn-AI supports integration with Elasticsearch to store scenario configurations, run results, and metrics. This allows you to centralize and query experiment data using Elasticsearch’s search and visualization capabilities (e.g., with Kibana).
Configuration Parameters
enable (bool): Set to true to enable saving results to Elasticsearch. Default: false.server (string): URL or address of your Elasticsearch server (e.g., http://localhost).port (int): Port to connect to Elasticsearch (default: 9200).username (string): Username for Elasticsearch authentication (can reference environment variables).password (string): Password for Elasticsearch authentication. If using environment substitution, prefix with __ to treat as private.verify_certs (bool): Set to true to verify SSL certificates. Default: true.index (string): Name prefix for the Elasticsearch index where Krkn-AI results will be stored (e.g., krkn-ai).
Example Configuration
elastic:
  enable: true                      # Enable Elasticsearch integration
  server: "http://localhost"        # Elasticsearch server URL
  port: 9200                        # Elasticsearch port
  username: "$ES_USER"              # Username (environment substitution supported)
  password: "$__ES_PASSWORD"        # Password (start with __ for sensitive/private handling)
  verify_certs: true                # Verify SSL certificates
  index: "krkn-ai"                  # Index prefix for storing results
In addition to the standard Krkn telemetry and metrics indices, Krkn-AI creates two dedicated Elasticsearch indices to store detailed run information:
krkn-ai-config: Stores comprehensive information about the Krkn-AI configuration for each run, including parameters for the genetic algorithm, enabled scenarios, SLO definitions, and other configuration details.krkn-ai-results: Stores the results of each Krkn-AI run, such as fitness scores, health check evaluations, and related metrics.
Note: Depending on the complexity and number of scenarios executed, Krkn-AI can generate a significant amount of metrics and data per run. Ensure that your Elasticsearch deployment is sized appropriately to handle this volume.
6 - Monitoring Dashboard Guide
Monitor Krkn-AI experiment results with an interactive dashboard.
Monitoring Dashboard Guide
The krkn_ai monitor command launches a Streamlit-based interactive dashboard that lets you inspect experiment results, either as a live view during an active run or as a post-run analysis tool once the experiment has completed.
Overview
Krkn-AI stores results in a structured output directory after every run. The monitoring dashboard reads those files and presents them through a browser-based UI built with Streamlit. All charts are interactive (powered by Plotly) and the dashboard auto-refreshes while a run is in progress.
Viewing Results During a Live Run
To launch the dashboard alongside an active experiment, pass the --monitoring flag to krkn_ai run:
uv run krkn_ai run \
  -c ./krkn-ai.yaml \
  -o ./results/ \
  --monitoring
This starts the dashboard as a background process pointing at the run’s output directory. By default it listens on port 8501. Open your browser at:
To change the port:
uv run krkn_ai run \
  -c ./krkn-ai.yaml \
  -o ./results/ \
  --monitoring --port 9000
Note: The dashboard process continues running even after the experiment finishes. A message like "Run finished. Monitoring dashboard will remain running. Terminate manually when done." is logged. You must stop it manually (e.g., with Ctrl+C or by killing the process).
While the run is in progress the sidebar displays “Execution in progress…” and the dashboard polls for new data every 3 seconds, so charts update automatically as each generation completes.
Viewing Results After a Completed Run
Use the standalone monitor sub-command to open the dashboard against a previously saved results directory:
uv run krkn_ai monitor -o ./results/
Flag Reference
| Flag |
Short |
Default |
Description |
--output |
-o |
./ |
Path to the directory that contains the run results (the parent folder holding UUID-named sub-directories, or a specific run UUID directory). |
--port |
-p |
8501 |
TCP port on which the Streamlit server will listen. |
--help |
|
|
Print usage and exit. |
Examples:
# View latest results from the default output directory
uv run krkn_ai monitor -o ./results/

# Use a specific port
uv run krkn_ai monitor -o ./results/ -p 9090

# Point directly at a specific run UUID directory
uv run krkn_ai monitor -o ./results/3f8a1c2d-9b4e-4f1a-8c7d-1234567890ab
Note
When -o points to a parent directory (e.g., ./results/) the dashboard automatically discovers all UUID-named sub-directories and lets you switch between runs from the sidebar. When -o points directly to a single run directory the sidebar run-selector is hidden.
Understanding the Output Directory Layout
Each krkn_ai run invocation creates a subdirectory named by its UUID inside --output:
results/
└── <run-uuid>/
    ├── run.log                   # Full execution log
    ├── results.json              # Machine-readable run status
    ├── krkn-ai.yaml              # Config snapshot used for this run
    ├── dashboard.log             # Dashboard server log (if --monitoring used)
    ├── reports/
    │   ├── all.csv               # Scenario-level results (main data source)
    │   ├── health_check_report.csv
    │   ├── best_scenarios.yaml
    │   └── graphs/
    │       ├── best_generation.png
    │       └── scenario_N.png
    ├── yaml/
    │   └── generation_N/
    │       └── scenario_N.yaml
    └── logs/
        └── scenario_N.log
The dashboard reads reports/all.csv, reports/health_check_report.csv, and the per-scenario YAML telemetry files. results.json is used to determine run status (started / in-progress / completed / failed).
Visualisation Layer Walkthrough
The dashboard is divided into a sidebar (controls and global filters) and seven tabs covering different aspects of the experiment.
Run Selector: appears only when the output directory contains multiple UUID runs. Results are sorted by last-modified time (newest first).
Status indicator: reflects the value in results.json:
- “Execution in progress…” - run is active; dashboard auto-refreshes every 3 s.
- “Execution completed!” - run finished successfully.
- “Execution failed!” - run terminated with an error.
- “Execution status unknown.” - status could not be read.
Global Filters: applied consistently across all tabs:
- Filter by Generation - show only the selected generation numbers.
- Filter by Scenario Name - filter by scenario type (e.g.,
pod-scenarios).
- Filter by Scenario Number - filter by numeric scenario IDs.
- Filter by Service - filter health-check and detailed telemetry by service/component name.
Best Iterations Scope: further narrows the results dataset:
- Top K scenarios by above score - keep only the top-K rows by the selected score column.
- Top P(%) scenarios by above score - keep only the top P percent of rows.
Export Report: generates a self-contained HTML report from the current view (respects all active filters). Click Download Report to save it locally.
Dashboard
The Dashboard tab shows a high-level experiment summary.
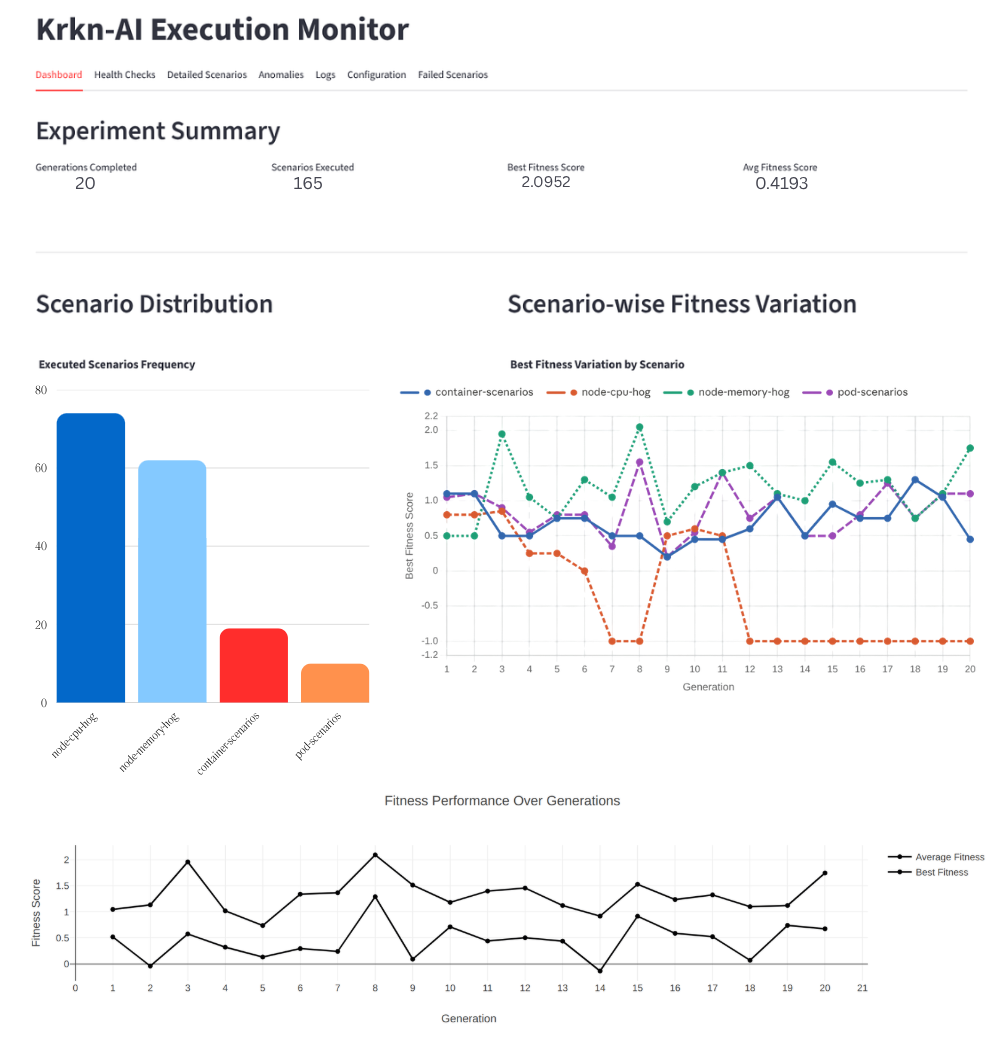
| Panel |
Description |
| Experiment Summary |
Four metric cards: generations completed, total scenarios executed, best fitness score, and average fitness score. |
| Fitness Score Evolution |
Line chart with two series: Best Fitness and Average Fitness per generation. Hover for exact values. |
| Scenario Distribution |
Histogram showing how often each chaos scenario type was executed across all generations. |
| Scenario-wise Fitness Variation |
Per-scenario line chart of best fitness across generations. Useful for identifying which scenario type consistently achieves high fitness. |
| Generation & Scenario Details |
Sortable table of all executed scenarios (generation, scenario ID/name, duration, individual score components, fitness). A generation dropdown lets you drill into a specific generation. |
| Score Delta vs Baseline |
Grouped bar chart showing the delta of each score component (fitness, health check failure, health check response time, krkn failure) relative to the baseline scenario. Bars above zero indicate improvement over baseline. |
| Fitness Improvement Trend vs Baseline |
Area/line chart showing per-generation best and average fitness as a percentage improvement over the baseline. Positive values mean the evolved scenarios are better than running with no chaos. |
Health Checks
The Health Checks tab visualises service availability and latency during chaos experiments.
| Panel |
Description |
| Latency Heatmap |
Matrix of Scenario ID × Component coloured by the selected latency metric (average_response_time, max_response_time, or min_response_time). Darker/redder cells mean higher latency. |
| Scenario Trends |
Grouped bar chart showing the chosen latency metric per scenario, with bars grouped by service/component. Identifies which scenarios stress which services most. |
| Success vs Failure |
Stacked bar chart of cumulative success_count and failure_count per component across all scenarios. Reveals which services are most fragile under chaos. |
| Resilience Radar |
Polar/radar chart plotting a resilience score (1 / response_time) per component, coloured by scenario. Components whose polygon arms extend further are more responsive. |
| Response Range Plot |
Line-and-marker chart showing the min-to-max latency range per component. Wide ranges indicate high variability. |
| Components Table |
Tabular view of all health-check data, sortable by any metric. Use Top K Worst Performing Components to focus on the slowest or most failure-prone services. |
Data source: reports/health_check_report.csv
Detailed Scenarios
The Detailed Scenarios tab displays per-scenario YAML telemetry (service-level response times, request counts, and error rates) collected during each chaos run. Use it to understand the fine-grained impact of a specific scenario on individual services.
Data source: per-scenario YAML files under yaml/generation_N/.
Anomalies
The Anomalies tab runs automated anomaly detection across all experiment data and surfaces unusual behaviour that warrants investigation.
Detection Modes
| Mode |
How it works |
| Z-Score (default) |
Flags data points whose Z-score (x − μ) / σ exceeds a configurable threshold. ` |
| % Deviation |
Compares each value to the baseline scenario. ` |
Detectors
| Detector |
Anomaly Type Label |
Triggered when… |
| Fitness IQR |
Low Fitness (IQR) / High Fitness (IQR) |
Fitness score breaches IQR fences or falls below the baseline fitness. |
| Duration |
Duration (Execution Time) Anomaly (Z-score) |
Scenario duration deviates from the baseline/mean duration. |
| HC Failure Surge |
Health Check Failure Surge |
health_check_failure_score breaches the IQR upper fence or deviates ≥ 30% from baseline. |
| Fitness Regression |
Fitness Regression |
Best fitness drops from one generation to the next (> 20% drop → High, > 10% → Medium). |
| Service Failure Spike |
Service Failure Rate Spike |
Per-service failure rate is a Z-score outlier or deviates ≥ 30% from baseline. |
| Krkn Failure Score |
Krkn Failure Score Spike |
krkn_failure_score > 0 (non-zero = krkn engine error). Above IQR upper fence → High. |
| HC Response Time |
Health Check Response Time (Latency) Anomaly |
health_check_response_time_score exceeds the IQR upper fence and/or Z-score threshold. |
| Service RT Spike |
Service Response Time (Latency) Spike |
Per-service mean response time is a Z-score outlier or deviates ≥ 30% from baseline. |
Anomaly Map
The bubble scatter chart plots Anomaly Type (X-axis) against Scenario (Y-axis). Each bubble represents one detected anomaly:
- Size →
|z-score| in Z-Score mode, or |% deviation from baseline| in % Deviation mode
Anomaly Summary Metrics
| Metric |
Description |
| Total Anomalies |
Total anomaly events detected. |
| High Severity |
Count of High severity anomalies. |
| Medium Severity |
Count of Medium severity anomalies. |
| Low Severity |
Count of Low severity anomalies. |
| Anomaly Types |
Distinct anomaly categories triggered. |
Detected Anomalies Table
Every anomaly record is shown with: scenario_id, scenario, generation, anomaly_type, value, threshold, baseline_ref, z_score, severity, and detail. Use the Filter by Severity and Filter by Anomaly Type multi-selects to narrow results.
Logs
The Logs tab streams scenario execution logs from the logs/ subdirectory. Use the scenario dropdown to navigate between individual scenario log files.
Configuration
The Configuration tab renders the krkn-ai.yaml configuration snapshot used for the selected run, for auditing which scenarios, fitness functions, and health-check endpoints were active.
Failed Scenarios
The Failed Scenarios tab shows scenarios where krkn_failure_score < 0 (krkn engine misconfiguration or internal failure). The layout mirrors the Generation & Scenario Details table in Tab 1.
Exporting a Report
Click Generate HTML Report in the sidebar to generate a self-contained HTML file of the current view. After the spinner completes, click Download Report to save the file.
Configuring Anomaly Detection Thresholds
Thresholds are read from krkn_ai/dashboard/anomaly_config.yaml:
iqr_k: 1.5

severity:
  high_z: 2.5
  medium_z: 1.5
  high_pct: 60.0
  medium_pct: 30.0

duration:
  z_threshold: 1.5
  baseline_pct: 30.0

hc_failure:
  baseline_pct: 30.0

hc_response_time:
  z_threshold: 1.5
  baseline_pct: 30.0

service_response_time:
  z_threshold: 1.5
  baseline_pct: 30.0

fitness_regression:
  high_drop_pct: 20.0
  medium_drop_pct: 10.0
  z_div: 10.0
Edit this file and restart the dashboard to apply new thresholds.
Troubleshooting
| Symptom |
Likely Cause |
Resolution |
| “No recognised data files were found” |
Wrong output directory |
Pass the correct -o path; ensure results.json exists. |
"reports/all.csv exists but is empty" |
No scenario has completed yet |
Wait for the first generation to finish. |
| Charts empty but status shows “Execution completed” |
Filters are too narrow |
Clear all sidebar filters. |
| Port already in use |
Another Streamlit process is running |
Use -p <other-port>. |
| Dashboard does not auto-refresh |
Browser tab was backgrounded |
Bring the tab to the foreground. |