Using the UI
How to run scenarios and use the dashboard once it is running.
Using the UI
Once the dashboard is running, open http://localhost:3000 (or the port shown in the terminal) in your browser. The dashboard has a side menu with other dashboard views (Overview and Metrics). Each is described below.
Overview
The Overview page is the default landing page. It has two tabs at the top:
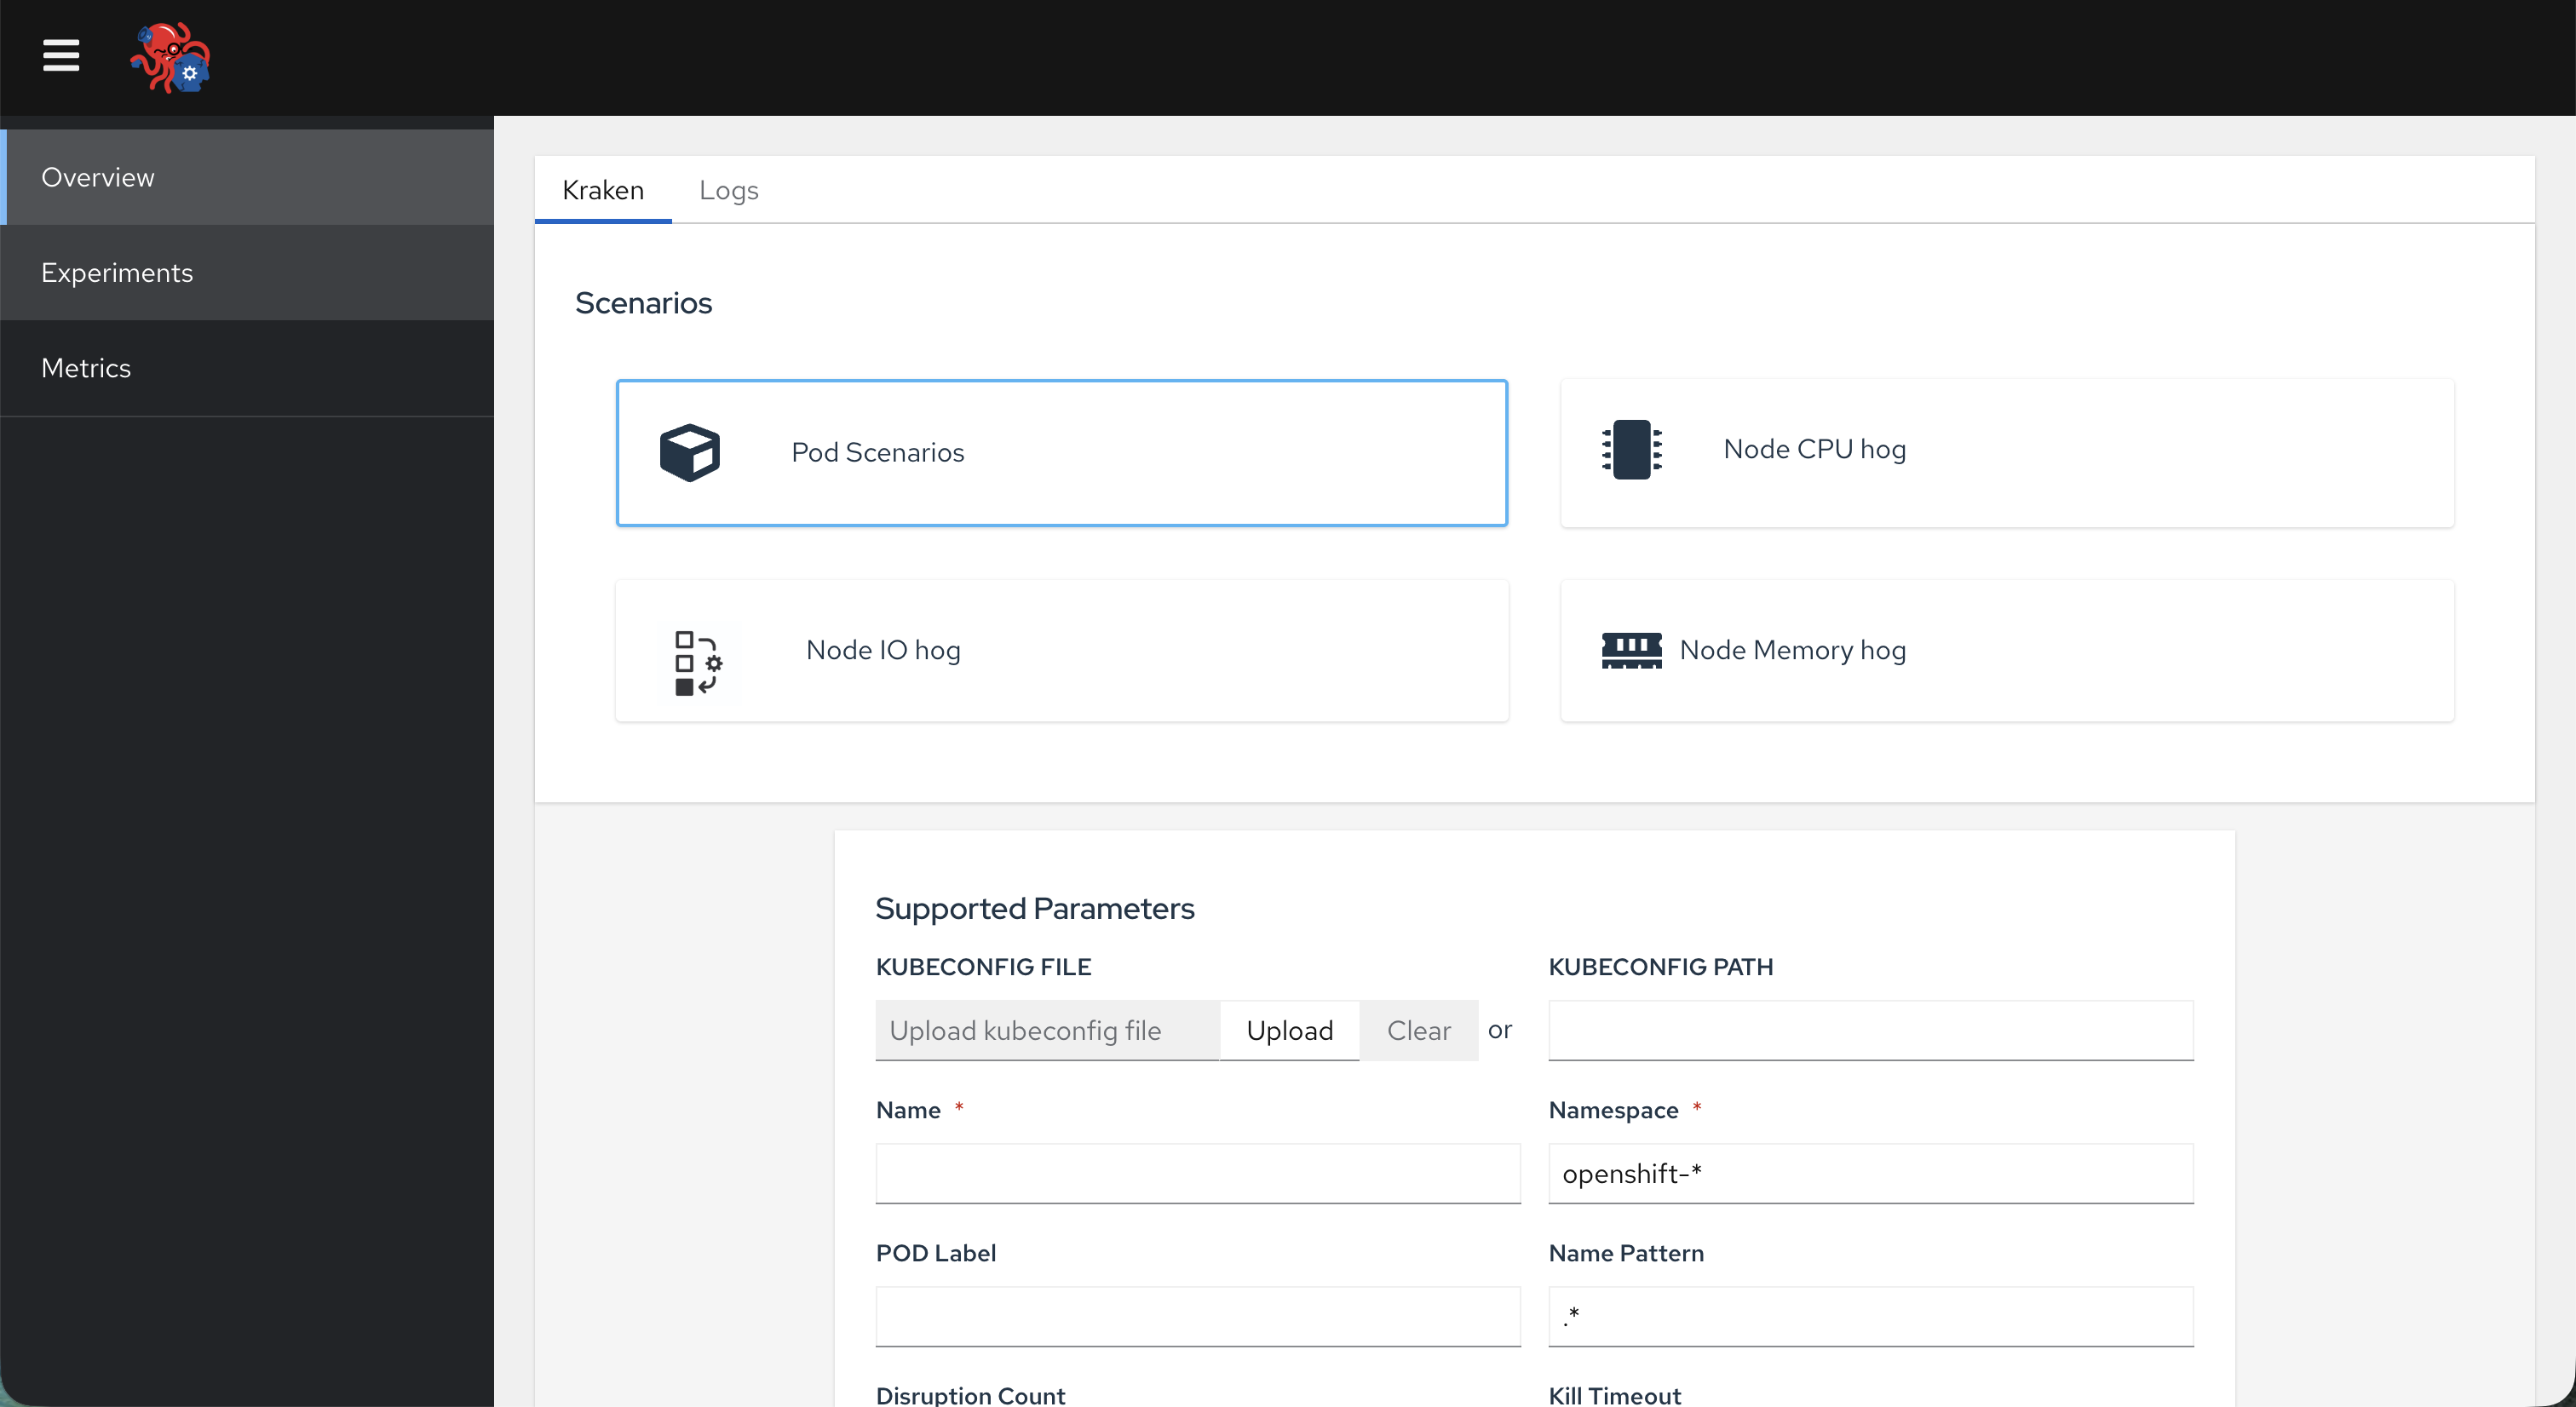
Kraken tab
- Scenarios card — A set of scenario tiles (e.g. Pod Scenarios, Node CPU hog, Node IO hog, Node Memory hog). Click a scenario to select it for the next run.
- Supported Parameters — Set your parameters for the selected scenario and either enter a kubeconfig path or upload a kubeconfig file. Use Start Kraken to launch the krkn-hub container for that scenario.
- Pod Details — A table of all krkn-hub containers known to the dashboard. Use this to see which chaos runs are active or finished.
Logs tab
- Logs viewer — A dropdown to select a running or past container (from the same list as Pod Details). Once selected, the panel shows that container’s live or captured logs so you can watch chaos output without using the terminal.
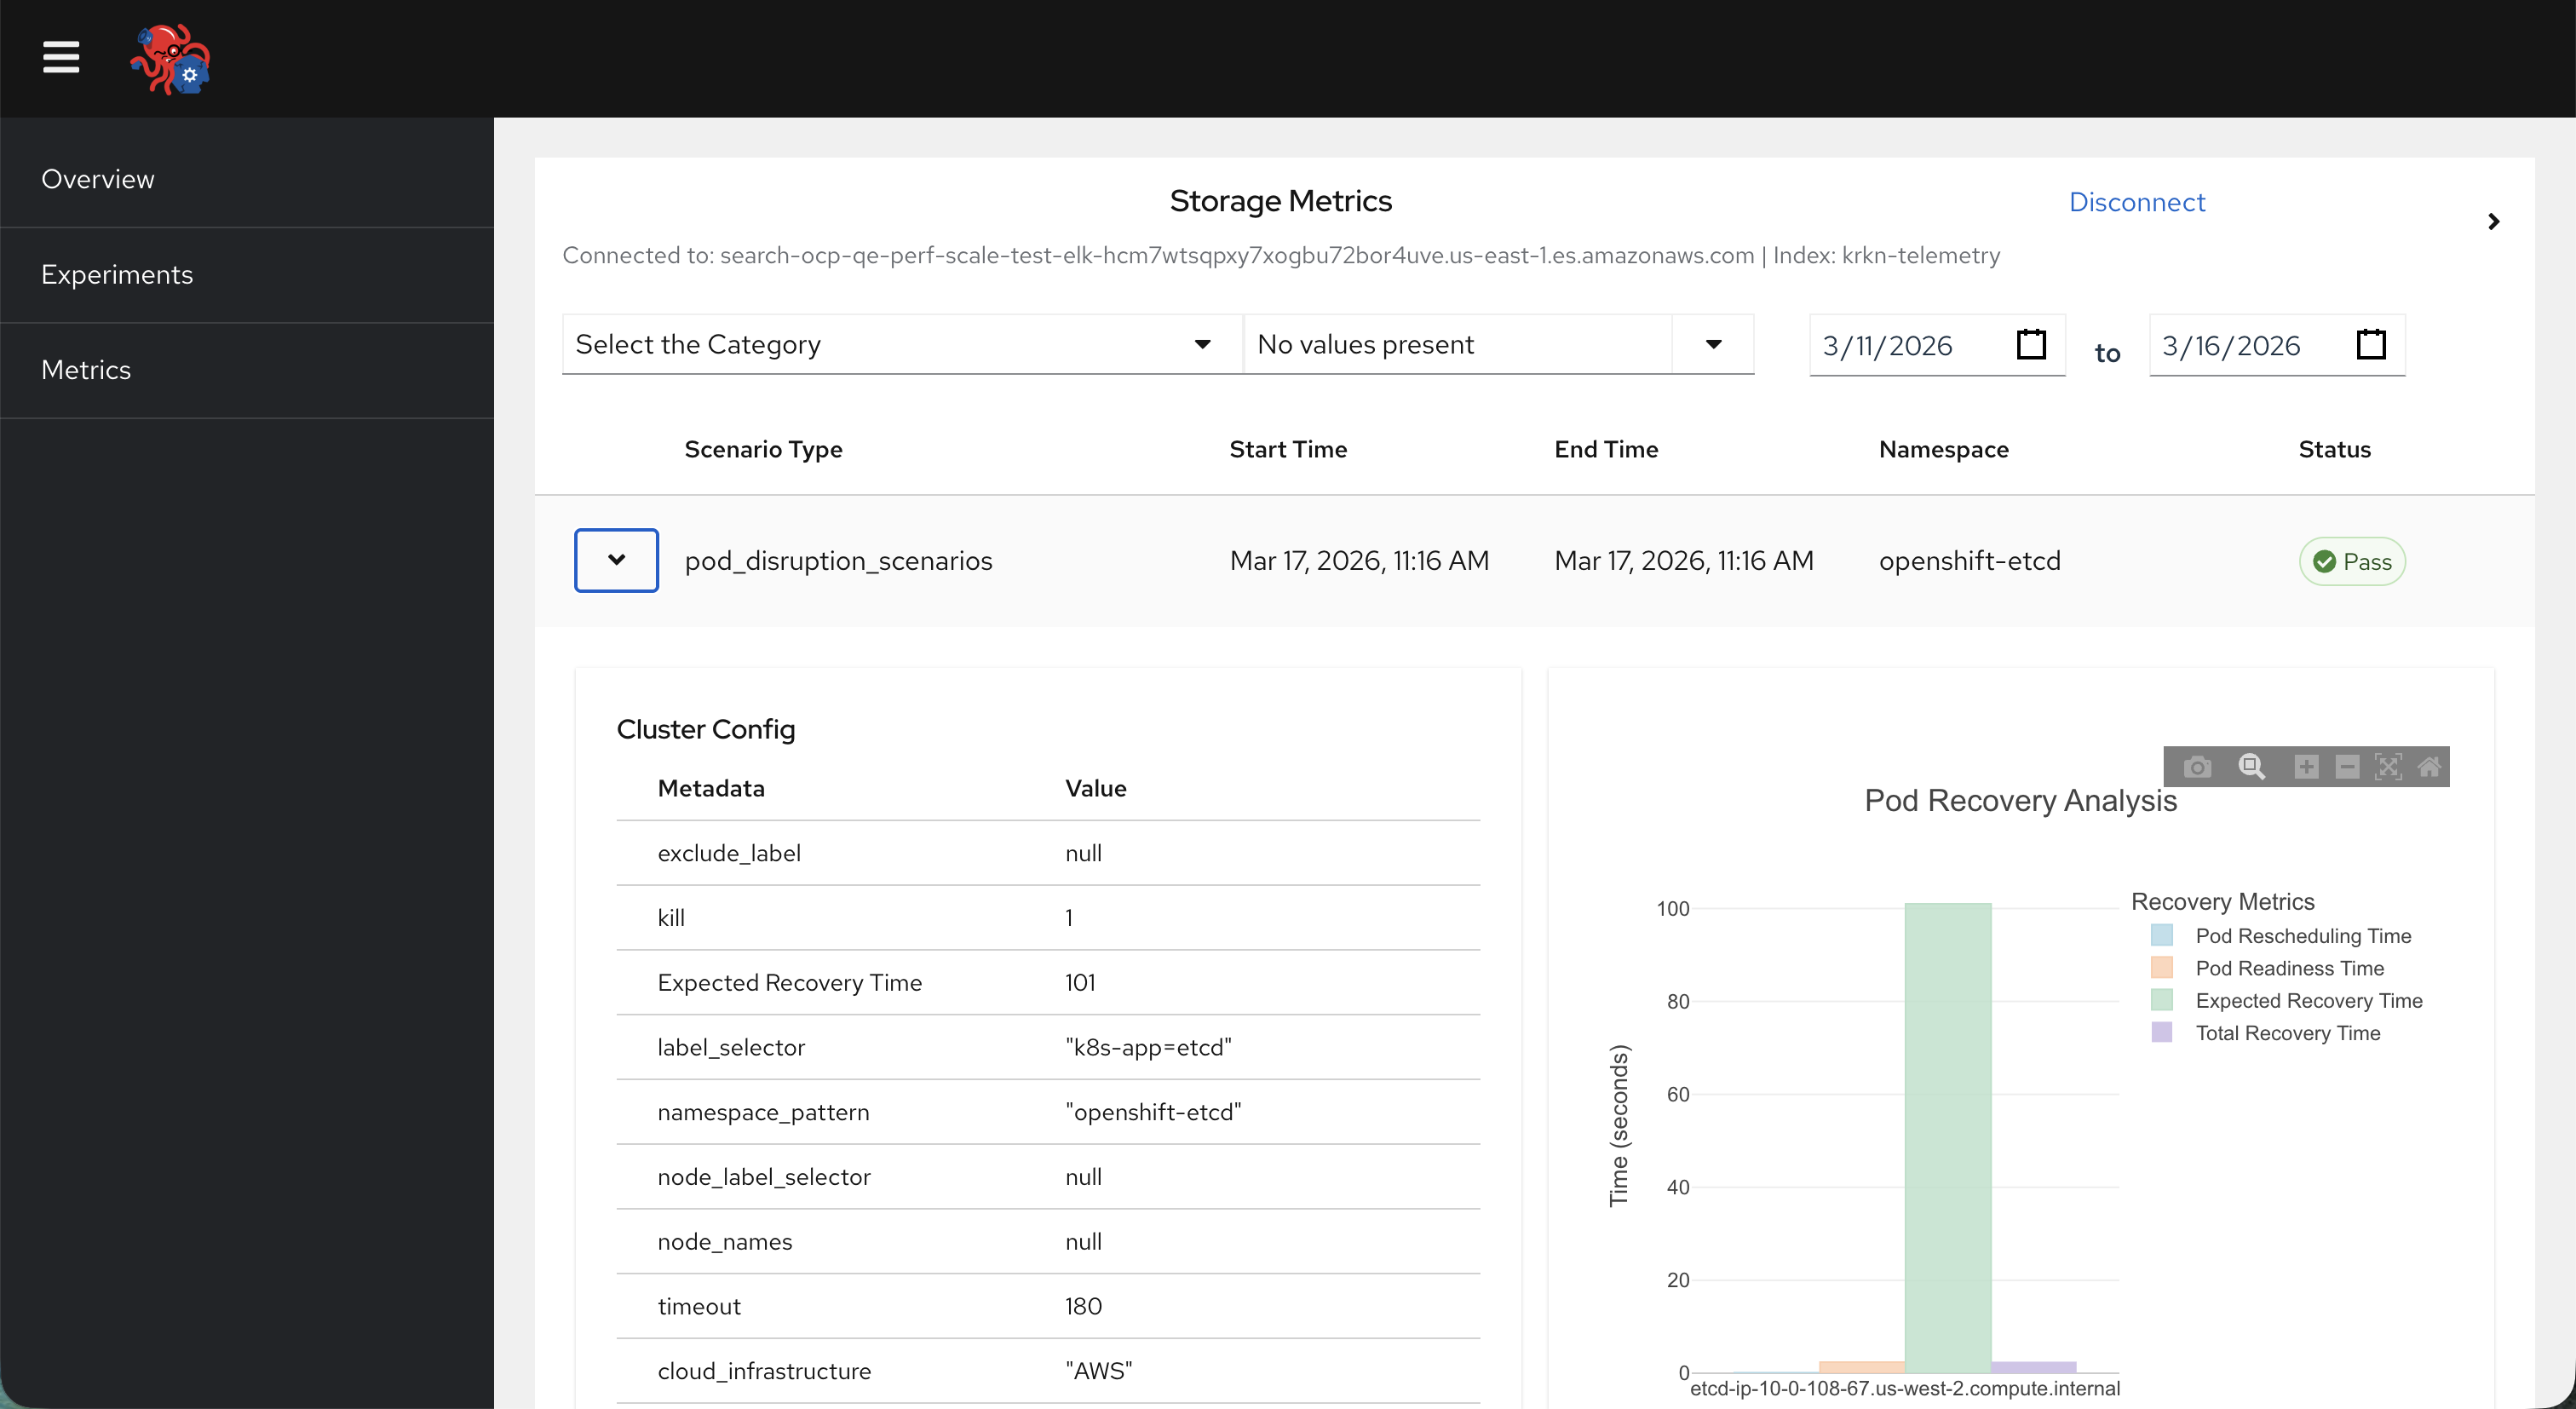
Metrics
The Metrics page is used for Elasticsearch and Grafana integration:
- Storage Metrics (when not connected): Shows a form to connect to Elasticsearch (host, index, optional username/password, optional Grafana base URL and datasource). After submitting, the dashboard queries ES for past run details.
- Storage table (when connected): The page generates graphics to better analyze run history. After a successful connection, a table of past runs from Elasticsearch appears. Rows can be expanded to show more details and, when Grafana is configured, a link to the Grafana dashboard for that run.