Performance Dashboards
Performance dashboards
Krkn-chaos repository collection gives you a way to install a grafana on the cluster with dashboards loaded to help with monitoring the cluster for things like resource usage to find the outliers, API stats, Etcd health, Critical alerts etc. As well as specific metrics related to your krkn runs if elasticsearch is enabled.
https://github.com/krkn-chaos/visualize
git clone https://github.com/krkn-chaos/visualize
cd krkn-visualize

./deploy.sh

OR

./deploy.sh -c oc  # openshift installation
The dashboards can be edited/modified to include your queries of interest by logging in as the admin user. New dasbhoards can be imported using the import script and following directions defined here
cd krkn-visualize
./import.sh -i ../rendered/<folder>/<dashboard_name>.json
NOTE: The dashboards leverage Prometheus for scraping the metrics off of the cluster and supports OpenShift automatically, but the user would need to install Prometheus on a kuberentes cluster before dashboards are deployed. Once Prometheus is setup on the cluster it’ll leverage route objects to expose the grafana dashboards externally
If you don’t have elasticsearch or prometheus installed on your cluster, you can use helm to help you deploy these services. See these helpful commands on how to install them
Krkn Dashboards
- Pod Scenarios
- Node Scenarios
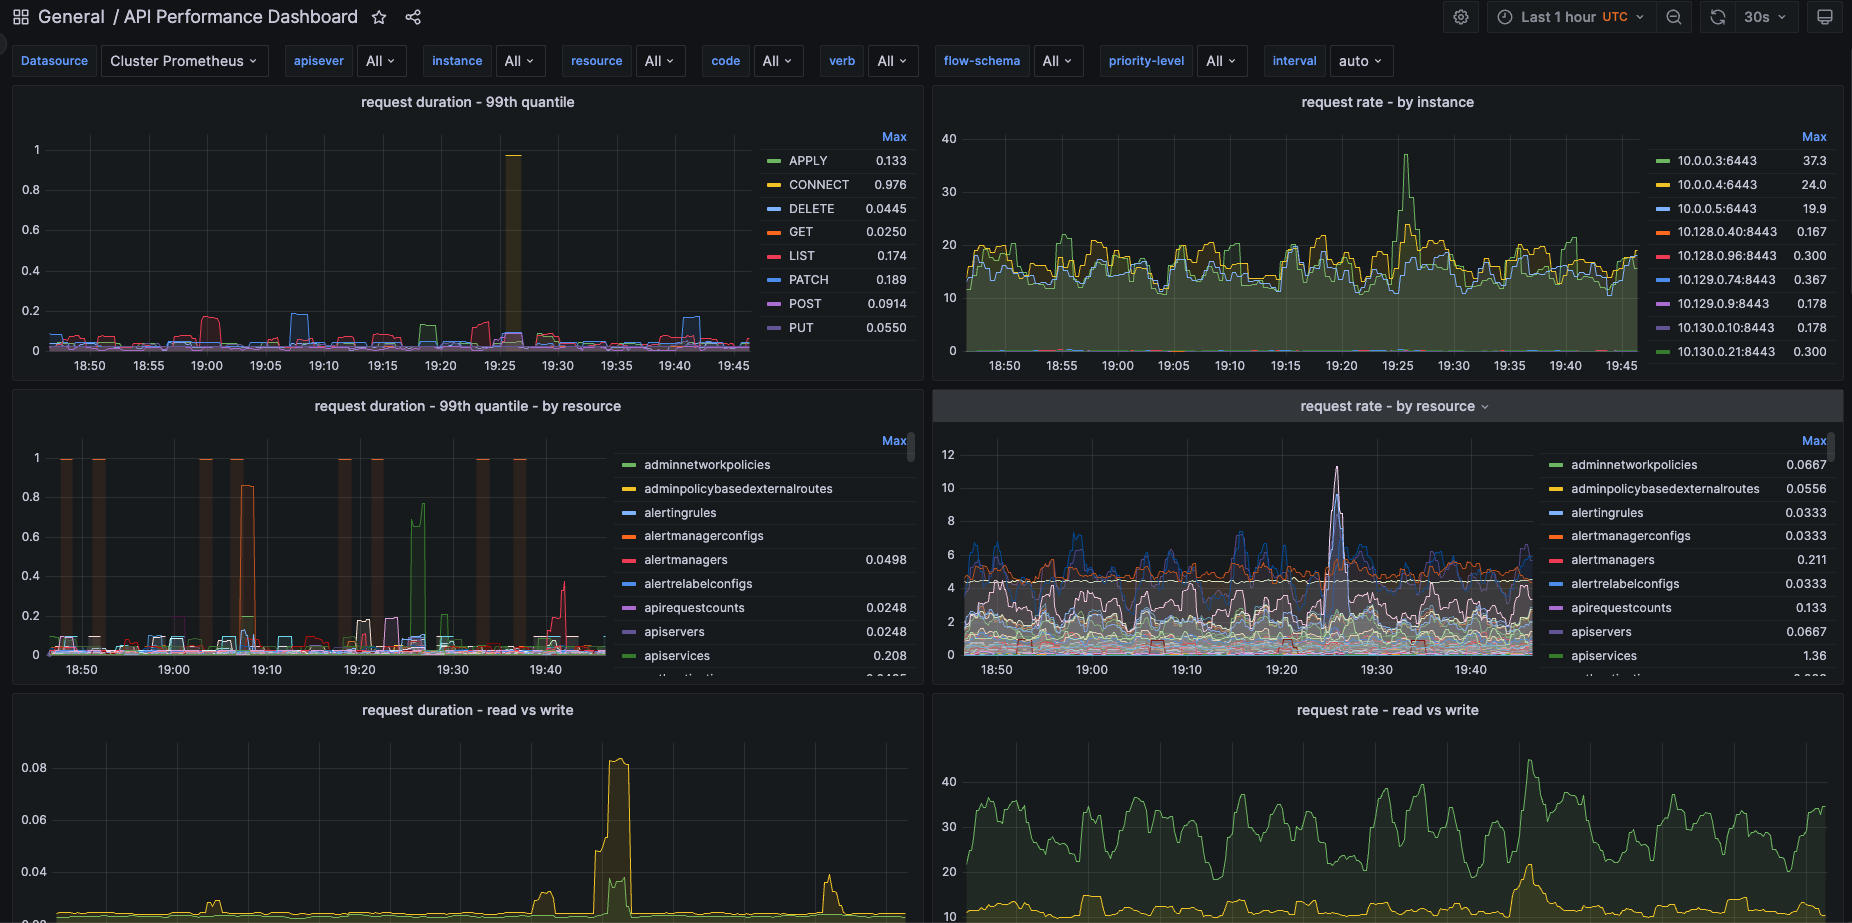
OpenShift Dashboards
- API Performance
- Etcd
- General OCP Performance
- OVN
- and Krkn Dashboards
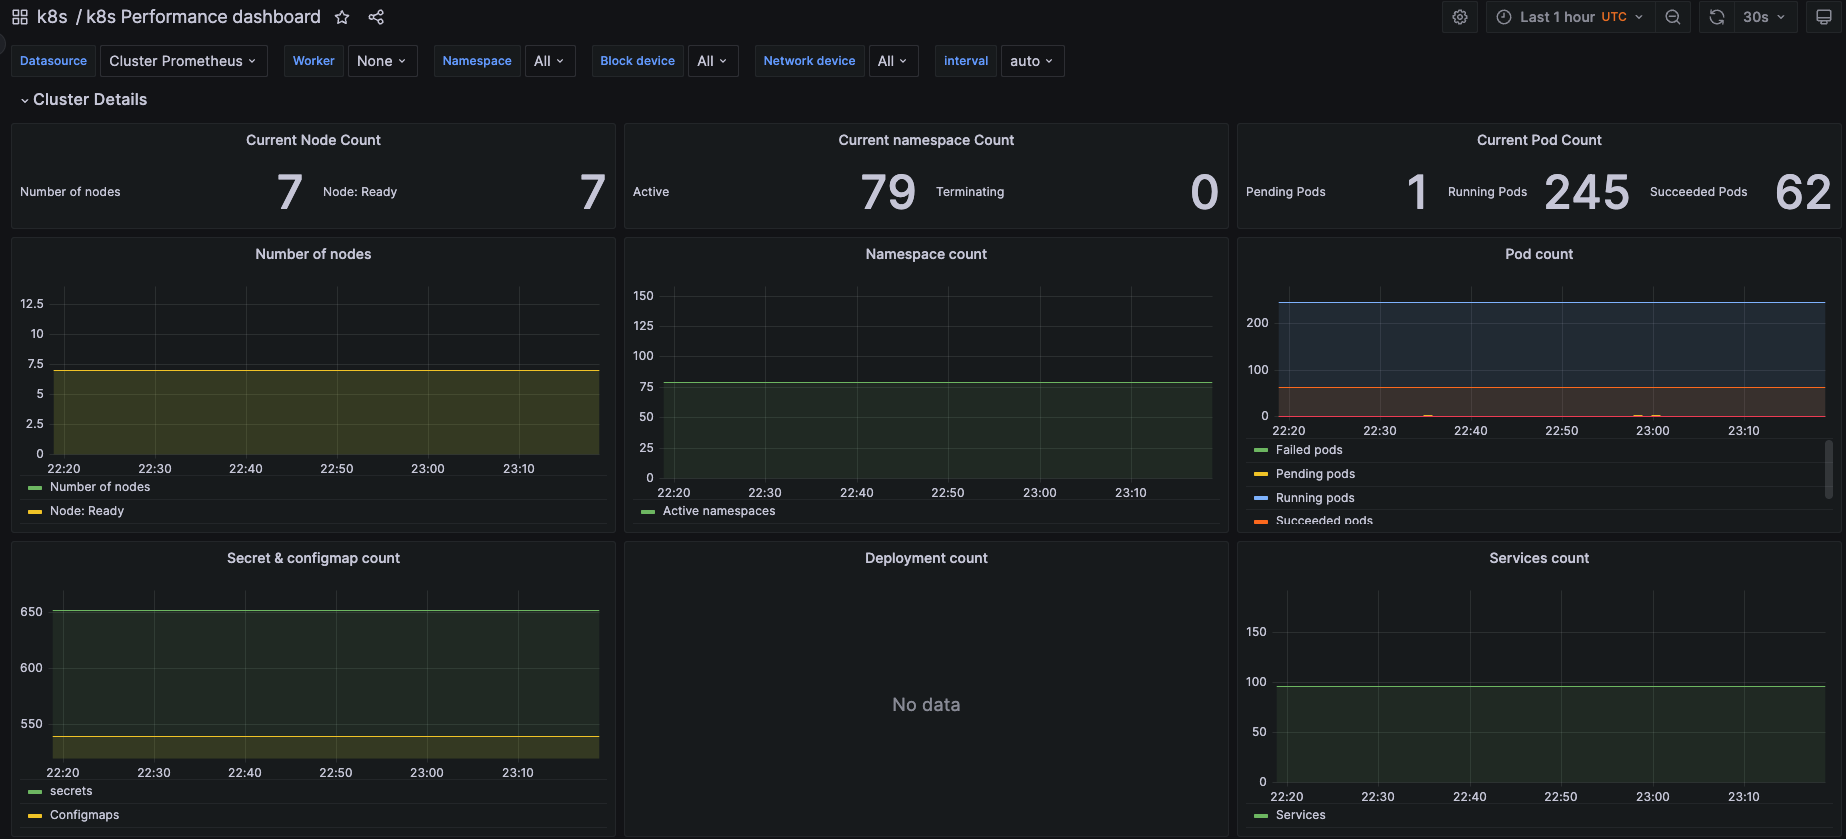
K8s Dashboards
- General K8s Performance
- and Krkn Dashboards